Immigrants from Laos vs Immigrants from Burma/Myanmar College, Under 1 year
COMPARE
Immigrants from Laos
Immigrants from Burma/Myanmar
College, Under 1 year
College, Under 1 year Comparison
Immigrants from Laos
Immigrants from Burma/Myanmar
61.3%
COLLEGE, UNDER 1 YEAR
0.3/ 100
METRIC RATING
257th/ 347
METRIC RANK
62.5%
COLLEGE, UNDER 1 YEAR
1.6/ 100
METRIC RATING
237th/ 347
METRIC RANK
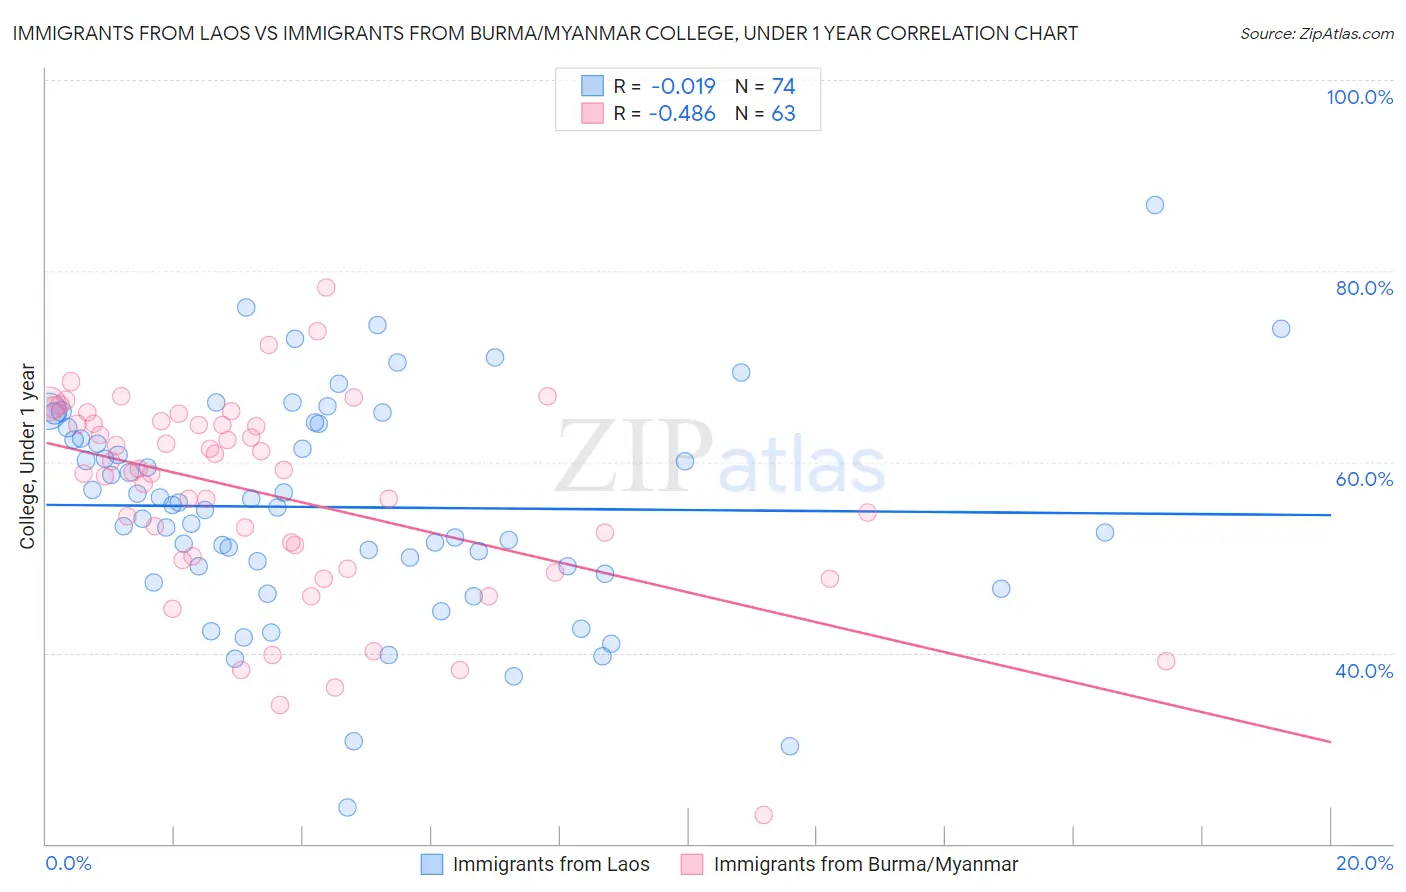
Immigrants from Laos vs Immigrants from Burma/Myanmar College, Under 1 year Correlation Chart
The statistical analysis conducted on geographies consisting of 201,475,732 people shows no correlation between the proportion of Immigrants from Laos and percentage of population with at least college, under 1 year education in the United States with a correlation coefficient (R) of -0.019 and weighted average of 61.3%. Similarly, the statistical analysis conducted on geographies consisting of 172,357,324 people shows a moderate negative correlation between the proportion of Immigrants from Burma/Myanmar and percentage of population with at least college, under 1 year education in the United States with a correlation coefficient (R) of -0.486 and weighted average of 62.5%, a difference of 1.9%.
College, Under 1 year Correlation Summary
| Measurement | Immigrants from Laos | Immigrants from Burma/Myanmar |
| Minimum | 23.8% | 23.1% |
| Maximum | 86.9% | 78.3% |
| Range | 63.2% | 55.2% |
| Mean | 55.2% | 56.5% |
| Median | 55.3% | 58.9% |
| Interquartile 25% (IQ1) | 49.0% | 49.7% |
| Interquartile 75% (IQ3) | 63.6% | 64.1% |
| Interquartile Range (IQR) | 14.5% | 14.4% |
| Standard Deviation (Sample) | 11.4% | 10.7% |
| Standard Deviation (Population) | 11.4% | 10.6% |
Demographics Similar to Immigrants from Laos and Immigrants from Burma/Myanmar by College, Under 1 year
In terms of college, under 1 year, the demographic groups most similar to Immigrants from Laos are Bangladeshi (61.4%, a difference of 0.11%), Comanche (61.4%, a difference of 0.16%), West Indian (61.5%, a difference of 0.28%), Japanese (61.5%, a difference of 0.28%), and Immigrants from Cambodia (61.5%, a difference of 0.28%). Similarly, the demographic groups most similar to Immigrants from Burma/Myanmar are French American Indian (62.4%, a difference of 0.090%), Nepalese (62.2%, a difference of 0.43%), Aleut (62.2%, a difference of 0.44%), Ottawa (62.2%, a difference of 0.44%), and Malaysian (62.2%, a difference of 0.49%).
| Demographics | Rating | Rank | College, Under 1 year |
| Immigrants | Burma/Myanmar | 1.6 /100 | #237 | Tragic 62.5% |
| French American Indians | 1.5 /100 | #238 | Tragic 62.4% |
| Nepalese | 1.1 /100 | #239 | Tragic 62.2% |
| Aleuts | 1.1 /100 | #240 | Tragic 62.2% |
| Ottawa | 1.1 /100 | #241 | Tragic 62.2% |
| Malaysians | 1.1 /100 | #242 | Tragic 62.2% |
| Hawaiians | 1.1 /100 | #243 | Tragic 62.1% |
| Colville | 1.0 /100 | #244 | Tragic 62.1% |
| Delaware | 0.9 /100 | #245 | Tragic 62.1% |
| Marshallese | 0.8 /100 | #246 | Tragic 61.9% |
| Immigrants | Liberia | 0.8 /100 | #247 | Tragic 61.9% |
| Potawatomi | 0.6 /100 | #248 | Tragic 61.8% |
| Vietnamese | 0.5 /100 | #249 | Tragic 61.7% |
| Immigrants | Congo | 0.5 /100 | #250 | Tragic 61.7% |
| Immigrants | Micronesia | 0.5 /100 | #251 | Tragic 61.5% |
| West Indians | 0.4 /100 | #252 | Tragic 61.5% |
| Japanese | 0.4 /100 | #253 | Tragic 61.5% |
| Immigrants | Cambodia | 0.4 /100 | #254 | Tragic 61.5% |
| Comanche | 0.4 /100 | #255 | Tragic 61.4% |
| Bangladeshis | 0.4 /100 | #256 | Tragic 61.4% |
| Immigrants | Laos | 0.3 /100 | #257 | Tragic 61.3% |