Immigrants from Zimbabwe vs Spanish American Indian GED/Equivalency
COMPARE
Immigrants from Zimbabwe
Spanish American Indian
GED/Equivalency
GED/Equivalency Comparison
Immigrants from Zimbabwe
Spanish American Indians
87.1%
GED/EQUIVALENCY
95.8/ 100
METRIC RATING
106th/ 347
METRIC RANK
76.3%
GED/EQUIVALENCY
0.0/ 100
METRIC RATING
344th/ 347
METRIC RANK
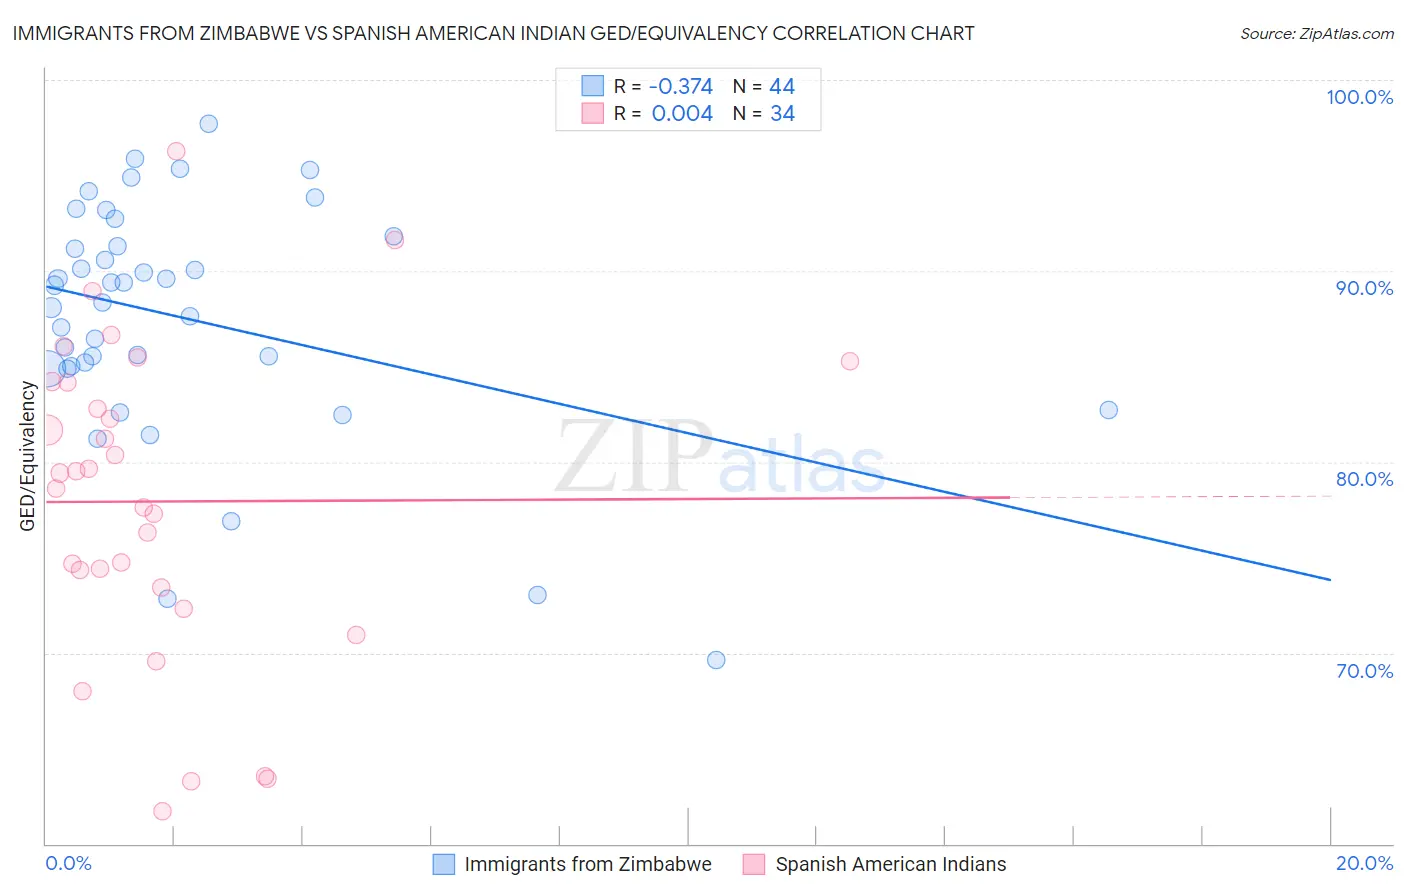
Immigrants from Zimbabwe vs Spanish American Indian GED/Equivalency Correlation Chart
The statistical analysis conducted on geographies consisting of 117,809,864 people shows a mild negative correlation between the proportion of Immigrants from Zimbabwe and percentage of population with at least ged/equivalency education in the United States with a correlation coefficient (R) of -0.374 and weighted average of 87.1%. Similarly, the statistical analysis conducted on geographies consisting of 73,147,813 people shows no correlation between the proportion of Spanish American Indians and percentage of population with at least ged/equivalency education in the United States with a correlation coefficient (R) of 0.004 and weighted average of 76.3%, a difference of 14.1%.
GED/Equivalency Correlation Summary
| Measurement | Immigrants from Zimbabwe | Spanish American Indian |
| Minimum | 69.6% | 61.7% |
| Maximum | 97.7% | 96.3% |
| Range | 28.1% | 34.6% |
| Mean | 87.5% | 77.9% |
| Median | 88.8% | 79.0% |
| Interquartile 25% (IQ1) | 84.9% | 73.4% |
| Interquartile 75% (IQ3) | 91.6% | 84.2% |
| Interquartile Range (IQR) | 6.6% | 10.8% |
| Standard Deviation (Sample) | 6.2% | 8.3% |
| Standard Deviation (Population) | 6.2% | 8.2% |
Similar Demographics by GED/Equivalency
Demographics Similar to Immigrants from Zimbabwe by GED/Equivalency
In terms of ged/equivalency, the demographic groups most similar to Immigrants from Zimbabwe are Icelander (87.1%, a difference of 0.010%), Indian (Asian) (87.1%, a difference of 0.020%), Immigrants from Hungary (87.2%, a difference of 0.030%), Canadian (87.1%, a difference of 0.030%), and Jordanian (87.2%, a difference of 0.040%).
| Demographics | Rating | Rank | GED/Equivalency |
| Immigrants | Belarus | 96.9 /100 | #99 | Exceptional 87.3% |
| Palestinians | 96.8 /100 | #100 | Exceptional 87.3% |
| Syrians | 96.6 /100 | #101 | Exceptional 87.2% |
| Lebanese | 96.2 /100 | #102 | Exceptional 87.2% |
| Jordanians | 96.1 /100 | #103 | Exceptional 87.2% |
| Immigrants | Hungary | 96.0 /100 | #104 | Exceptional 87.2% |
| Indians (Asian) | 95.9 /100 | #105 | Exceptional 87.1% |
| Immigrants | Zimbabwe | 95.8 /100 | #106 | Exceptional 87.1% |
| Icelanders | 95.7 /100 | #107 | Exceptional 87.1% |
| Canadians | 95.6 /100 | #108 | Exceptional 87.1% |
| Immigrants | Eastern Europe | 95.5 /100 | #109 | Exceptional 87.1% |
| Egyptians | 95.3 /100 | #110 | Exceptional 87.1% |
| French | 95.2 /100 | #111 | Exceptional 87.1% |
| Tlingit-Haida | 94.8 /100 | #112 | Exceptional 87.0% |
| Assyrians/Chaldeans/Syriacs | 94.8 /100 | #113 | Exceptional 87.0% |
Demographics Similar to Spanish American Indians by GED/Equivalency
In terms of ged/equivalency, the demographic groups most similar to Spanish American Indians are Immigrants from Central America (76.4%, a difference of 0.030%), Pima (76.4%, a difference of 0.12%), Immigrants from Mexico (75.7%, a difference of 0.89%), Mexican (77.4%, a difference of 1.4%), and Tohono O'odham (77.5%, a difference of 1.5%).
| Demographics | Rating | Rank | GED/Equivalency |
| Salvadorans | 0.0 /100 | #333 | Tragic 78.6% |
| Guatemalans | 0.0 /100 | #334 | Tragic 78.5% |
| Immigrants | Latin America | 0.0 /100 | #335 | Tragic 78.5% |
| Immigrants | Dominican Republic | 0.0 /100 | #336 | Tragic 78.0% |
| Immigrants | Yemen | 0.0 /100 | #337 | Tragic 77.9% |
| Immigrants | Guatemala | 0.0 /100 | #338 | Tragic 77.9% |
| Immigrants | El Salvador | 0.0 /100 | #339 | Tragic 77.6% |
| Tohono O'odham | 0.0 /100 | #340 | Tragic 77.5% |
| Mexicans | 0.0 /100 | #341 | Tragic 77.4% |
| Pima | 0.0 /100 | #342 | Tragic 76.4% |
| Immigrants | Central America | 0.0 /100 | #343 | Tragic 76.4% |
| Spanish American Indians | 0.0 /100 | #344 | Tragic 76.3% |
| Immigrants | Mexico | 0.0 /100 | #345 | Tragic 75.7% |
| Houma | 0.0 /100 | #346 | Tragic 75.0% |
| Yakama | 0.0 /100 | #347 | Tragic 74.5% |