Immigrants from Eastern Asia vs Immigrants from Hong Kong GED/Equivalency
COMPARE
Immigrants from Eastern Asia
Immigrants from Hong Kong
GED/Equivalency
GED/Equivalency Comparison
Immigrants from Eastern Asia
Immigrants from Hong Kong
87.4%
GED/EQUIVALENCY
97.9/ 100
METRIC RATING
91st/ 347
METRIC RANK
86.9%
GED/EQUIVALENCY
93.8/ 100
METRIC RATING
117th/ 347
METRIC RANK
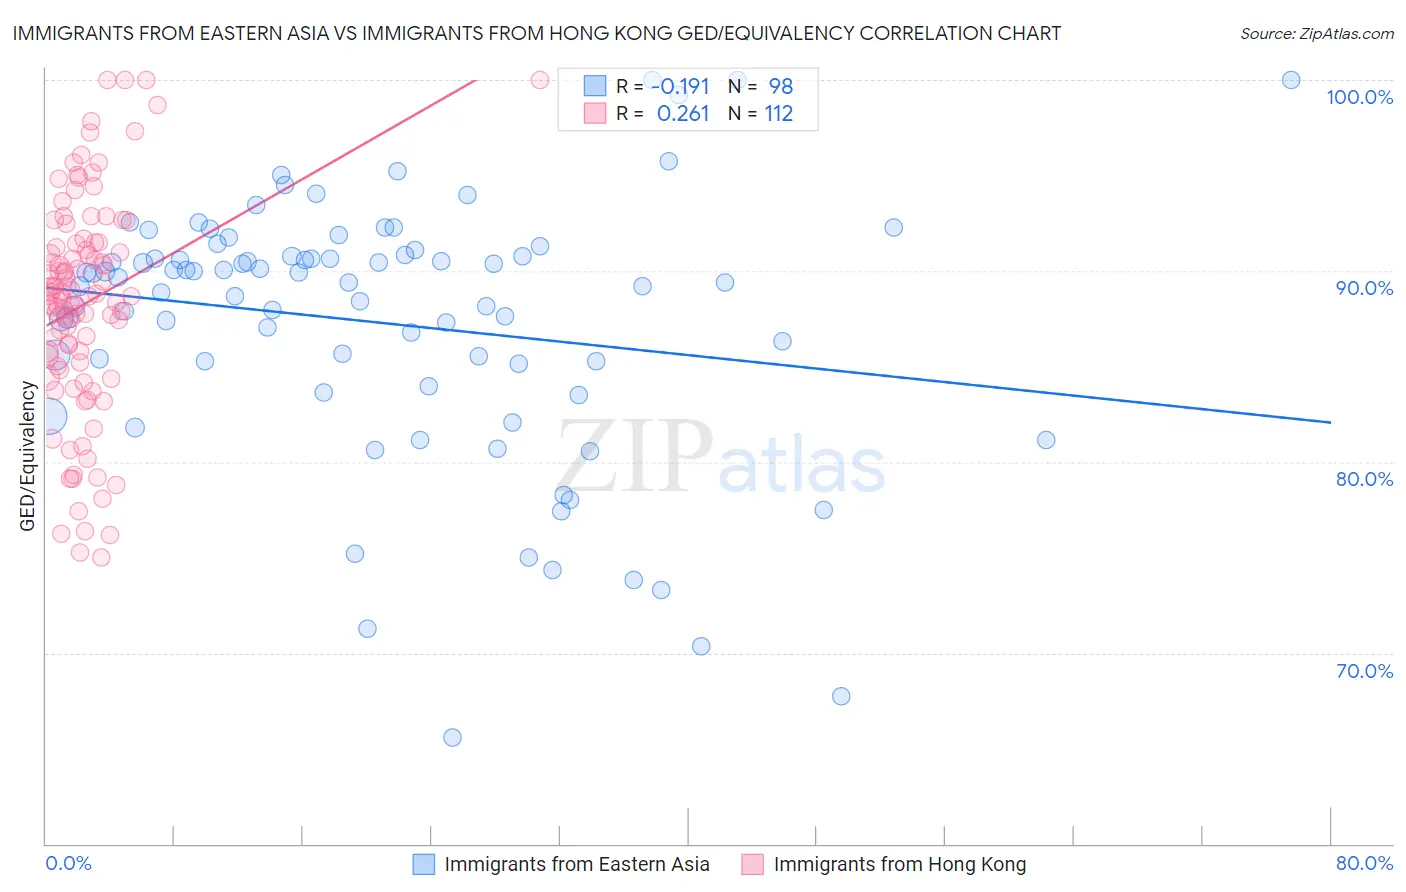
Immigrants from Eastern Asia vs Immigrants from Hong Kong GED/Equivalency Correlation Chart
The statistical analysis conducted on geographies consisting of 499,846,164 people shows a poor negative correlation between the proportion of Immigrants from Eastern Asia and percentage of population with at least ged/equivalency education in the United States with a correlation coefficient (R) of -0.191 and weighted average of 87.4%. Similarly, the statistical analysis conducted on geographies consisting of 253,990,250 people shows a weak positive correlation between the proportion of Immigrants from Hong Kong and percentage of population with at least ged/equivalency education in the United States with a correlation coefficient (R) of 0.261 and weighted average of 86.9%, a difference of 0.57%.
GED/Equivalency Correlation Summary
| Measurement | Immigrants from Eastern Asia | Immigrants from Hong Kong |
| Minimum | 65.6% | 75.0% |
| Maximum | 100.0% | 100.0% |
| Range | 34.4% | 25.0% |
| Mean | 87.3% | 88.3% |
| Median | 89.4% | 88.7% |
| Interquartile 25% (IQ1) | 85.1% | 85.1% |
| Interquartile 75% (IQ3) | 90.8% | 91.4% |
| Interquartile Range (IQR) | 5.6% | 6.3% |
| Standard Deviation (Sample) | 6.8% | 5.7% |
| Standard Deviation (Population) | 6.8% | 5.7% |
Similar Demographics by GED/Equivalency
Demographics Similar to Immigrants from Eastern Asia by GED/Equivalency
In terms of ged/equivalency, the demographic groups most similar to Immigrants from Eastern Asia are Hungarian (87.4%, a difference of 0.010%), Welsh (87.4%, a difference of 0.010%), Israeli (87.4%, a difference of 0.010%), Immigrants from North Macedonia (87.4%, a difference of 0.020%), and Immigrants from Russia (87.4%, a difference of 0.020%).
| Demographics | Rating | Rank | GED/Equivalency |
| Immigrants | Romania | 98.1 /100 | #84 | Exceptional 87.5% |
| Dutch | 98.1 /100 | #85 | Exceptional 87.5% |
| Immigrants | Europe | 98.1 /100 | #86 | Exceptional 87.5% |
| Native Hawaiians | 98.1 /100 | #87 | Exceptional 87.5% |
| Immigrants | Norway | 98.1 /100 | #88 | Exceptional 87.5% |
| Hungarians | 97.9 /100 | #89 | Exceptional 87.4% |
| Welsh | 97.9 /100 | #90 | Exceptional 87.4% |
| Immigrants | Eastern Asia | 97.9 /100 | #91 | Exceptional 87.4% |
| Israelis | 97.8 /100 | #92 | Exceptional 87.4% |
| Immigrants | North Macedonia | 97.8 /100 | #93 | Exceptional 87.4% |
| Immigrants | Russia | 97.8 /100 | #94 | Exceptional 87.4% |
| Immigrants | Greece | 97.7 /100 | #95 | Exceptional 87.4% |
| Czechoslovakians | 97.6 /100 | #96 | Exceptional 87.4% |
| Immigrants | Western Europe | 97.3 /100 | #97 | Exceptional 87.3% |
| Immigrants | Croatia | 96.9 /100 | #98 | Exceptional 87.3% |
Demographics Similar to Immigrants from Hong Kong by GED/Equivalency
In terms of ged/equivalency, the demographic groups most similar to Immigrants from Hong Kong are French Canadian (86.9%, a difference of 0.050%), Immigrants from China (86.9%, a difference of 0.050%), Swiss (87.0%, a difference of 0.070%), Mongolian (87.0%, a difference of 0.080%), and Immigrants from Kazakhstan (87.0%, a difference of 0.090%).
| Demographics | Rating | Rank | GED/Equivalency |
| Egyptians | 95.3 /100 | #110 | Exceptional 87.1% |
| French | 95.2 /100 | #111 | Exceptional 87.1% |
| Tlingit-Haida | 94.8 /100 | #112 | Exceptional 87.0% |
| Assyrians/Chaldeans/Syriacs | 94.8 /100 | #113 | Exceptional 87.0% |
| Immigrants | Kazakhstan | 94.7 /100 | #114 | Exceptional 87.0% |
| Mongolians | 94.6 /100 | #115 | Exceptional 87.0% |
| Swiss | 94.5 /100 | #116 | Exceptional 87.0% |
| Immigrants | Hong Kong | 93.8 /100 | #117 | Exceptional 86.9% |
| French Canadians | 93.2 /100 | #118 | Exceptional 86.9% |
| Immigrants | China | 93.2 /100 | #119 | Exceptional 86.9% |
| Scotch-Irish | 91.6 /100 | #120 | Exceptional 86.8% |
| Immigrants | Lebanon | 90.9 /100 | #121 | Exceptional 86.8% |
| Immigrants | Jordan | 90.8 /100 | #122 | Exceptional 86.8% |
| Immigrants | Italy | 90.5 /100 | #123 | Exceptional 86.7% |
| Immigrants | Egypt | 90.4 /100 | #124 | Exceptional 86.7% |