Immigrants from Saudi Arabia vs Immigrants from Hong Kong GED/Equivalency
COMPARE
Immigrants from Saudi Arabia
Immigrants from Hong Kong
GED/Equivalency
GED/Equivalency Comparison
Immigrants from Saudi Arabia
Immigrants from Hong Kong
87.8%
GED/EQUIVALENCY
99.0/ 100
METRIC RATING
69th/ 347
METRIC RANK
86.9%
GED/EQUIVALENCY
93.8/ 100
METRIC RATING
117th/ 347
METRIC RANK
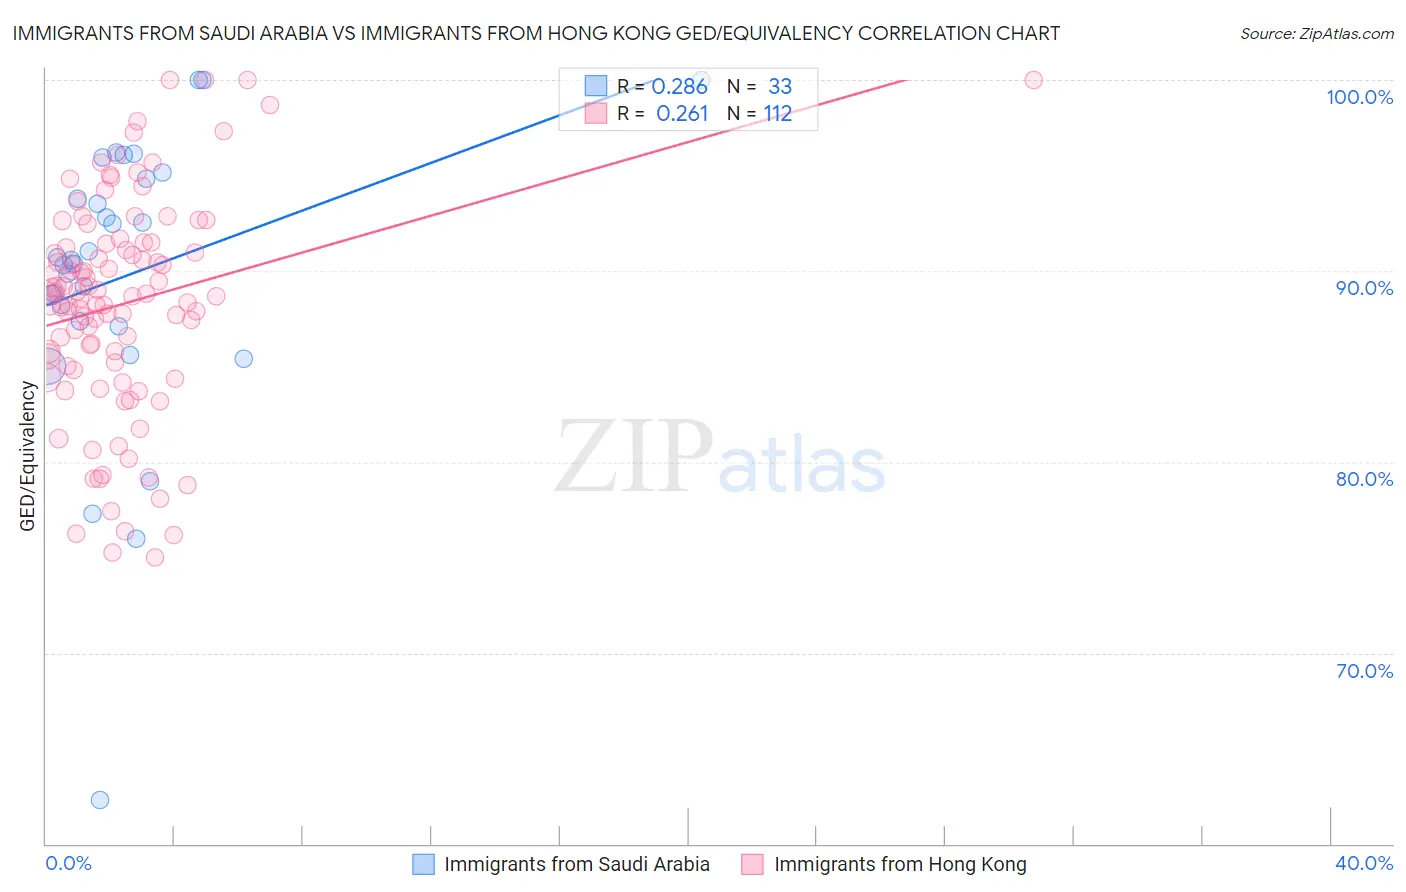
Immigrants from Saudi Arabia vs Immigrants from Hong Kong GED/Equivalency Correlation Chart
The statistical analysis conducted on geographies consisting of 164,289,382 people shows a weak positive correlation between the proportion of Immigrants from Saudi Arabia and percentage of population with at least ged/equivalency education in the United States with a correlation coefficient (R) of 0.286 and weighted average of 87.8%. Similarly, the statistical analysis conducted on geographies consisting of 253,990,250 people shows a weak positive correlation between the proportion of Immigrants from Hong Kong and percentage of population with at least ged/equivalency education in the United States with a correlation coefficient (R) of 0.261 and weighted average of 86.9%, a difference of 0.93%.
GED/Equivalency Correlation Summary
| Measurement | Immigrants from Saudi Arabia | Immigrants from Hong Kong |
| Minimum | 62.3% | 75.0% |
| Maximum | 100.0% | 100.0% |
| Range | 37.7% | 25.0% |
| Mean | 89.8% | 88.3% |
| Median | 90.6% | 88.7% |
| Interquartile 25% (IQ1) | 87.3% | 85.1% |
| Interquartile 75% (IQ3) | 95.0% | 91.4% |
| Interquartile Range (IQR) | 7.7% | 6.3% |
| Standard Deviation (Sample) | 7.7% | 5.7% |
| Standard Deviation (Population) | 7.6% | 5.7% |
Similar Demographics by GED/Equivalency
Demographics Similar to Immigrants from Saudi Arabia by GED/Equivalency
In terms of ged/equivalency, the demographic groups most similar to Immigrants from Saudi Arabia are Ukrainian (87.7%, a difference of 0.050%), Austrian (87.7%, a difference of 0.050%), Immigrants from Moldova (87.7%, a difference of 0.050%), Belgian (87.7%, a difference of 0.060%), and British (87.8%, a difference of 0.070%).
| Demographics | Rating | Rank | GED/Equivalency |
| Germans | 99.3 /100 | #62 | Exceptional 87.9% |
| Immigrants | Turkey | 99.2 /100 | #63 | Exceptional 87.9% |
| Immigrants | Canada | 99.2 /100 | #64 | Exceptional 87.9% |
| Immigrants | North America | 99.1 /100 | #65 | Exceptional 87.8% |
| Immigrants | Bulgaria | 99.1 /100 | #66 | Exceptional 87.8% |
| British | 99.1 /100 | #67 | Exceptional 87.8% |
| Immigrants | France | 99.1 /100 | #68 | Exceptional 87.8% |
| Immigrants | Saudi Arabia | 99.0 /100 | #69 | Exceptional 87.8% |
| Ukrainians | 98.8 /100 | #70 | Exceptional 87.7% |
| Austrians | 98.8 /100 | #71 | Exceptional 87.7% |
| Immigrants | Moldova | 98.8 /100 | #72 | Exceptional 87.7% |
| Belgians | 98.8 /100 | #73 | Exceptional 87.7% |
| Immigrants | Kuwait | 98.8 /100 | #74 | Exceptional 87.7% |
| Scottish | 98.7 /100 | #75 | Exceptional 87.7% |
| Immigrants | Serbia | 98.7 /100 | #76 | Exceptional 87.7% |
Demographics Similar to Immigrants from Hong Kong by GED/Equivalency
In terms of ged/equivalency, the demographic groups most similar to Immigrants from Hong Kong are French Canadian (86.9%, a difference of 0.050%), Immigrants from China (86.9%, a difference of 0.050%), Swiss (87.0%, a difference of 0.070%), Mongolian (87.0%, a difference of 0.080%), and Immigrants from Kazakhstan (87.0%, a difference of 0.090%).
| Demographics | Rating | Rank | GED/Equivalency |
| Egyptians | 95.3 /100 | #110 | Exceptional 87.1% |
| French | 95.2 /100 | #111 | Exceptional 87.1% |
| Tlingit-Haida | 94.8 /100 | #112 | Exceptional 87.0% |
| Assyrians/Chaldeans/Syriacs | 94.8 /100 | #113 | Exceptional 87.0% |
| Immigrants | Kazakhstan | 94.7 /100 | #114 | Exceptional 87.0% |
| Mongolians | 94.6 /100 | #115 | Exceptional 87.0% |
| Swiss | 94.5 /100 | #116 | Exceptional 87.0% |
| Immigrants | Hong Kong | 93.8 /100 | #117 | Exceptional 86.9% |
| French Canadians | 93.2 /100 | #118 | Exceptional 86.9% |
| Immigrants | China | 93.2 /100 | #119 | Exceptional 86.9% |
| Scotch-Irish | 91.6 /100 | #120 | Exceptional 86.8% |
| Immigrants | Lebanon | 90.9 /100 | #121 | Exceptional 86.8% |
| Immigrants | Jordan | 90.8 /100 | #122 | Exceptional 86.8% |
| Immigrants | Italy | 90.5 /100 | #123 | Exceptional 86.7% |
| Immigrants | Egypt | 90.4 /100 | #124 | Exceptional 86.7% |