Bulgarian vs Immigrants from Nepal Child Poverty Under the Age of 5

COMPARE

Bulgarian
Race
Ancestry
AfghanAfricanAlaska NativeAlaskan AthabascanAlbanianAleutAlsatianAmericanApacheArabArapahoArgentineanArmenianAssyrian/Chaldean/SyriacAustralianAustrianBahamianBangladeshiBarbadianBasqueBelgianBelizeanBermudanBhutaneseBlackfeetBolivianBrazilianBritishBritish West IndianBulgarianBurmeseCajunCambodianCanadianCape VerdeanCarpatho RusynCelticCentral AmericanCentral American IndianCherokeeCheyenneChickasawChileanChineseChippewaChoctawColombianColvilleComancheCosta RicanCreeCreekCroatianCrowCubanCypriotCzechCzechoslovakianDanishDelawareDominicanDutchDutch West IndianEastern EuropeanEcuadorianEgyptianEnglishEstonianEthiopianEuropeanFijianFilipinoFinnishFrenchFrench American IndianFrench CanadianGermanGerman RussianGhanaianGreekGuamanian/ChamorroGuatemalanGuyaneseHaitianHmongHonduranHopiHoumaHungarianIcelanderIndian (Asian)IndonesianInupiatIranianIraqiIrishIroquoisIsraeliItalianJamaicanJapaneseJordanianKenyanKiowaKoreanLaotianLatvianLebaneseLiberianLithuanianLumbeeLuxembourgerMacedonianMalaysianMalteseMarshalleseMenomineeMexicanMexican American IndianMongolianMoroccanNative HawaiianNavajoNepaleseNew ZealanderNicaraguanNigerianNorthern EuropeanNorwegianOkinawanOsageOttawaPaiutePakistaniPalestinianPanamanianParaguayanPennsylvania GermanPeruvianPimaPolishPortuguesePotawatomiPuebloPuerto RicanPuget Sound SalishRomanianRussianSalvadoranSamoanScandinavianScotch-IrishScottishSeminoleSenegaleseSerbianShoshoneSierra LeoneanSiouxSlavicSlovakSloveneSomaliSouth AfricanSouth AmericanSouth American IndianSoviet UnionSpaniardSpanishSpanish AmericanSpanish American IndianSri LankanSubsaharan AfricanSudaneseSwedishSwissSyrianTaiwaneseThaiTlingit-HaidaTohono O'OdhamTonganTrinidadian and TobagonianTsimshianTurkishU.S. Virgin IslanderUgandanUkrainianUruguayanUteVenezuelanVietnameseWelshWest IndianYakamaYaquiYugoslavianYumanYup'ikZimbabwean
Immigration
NonimmigrantsImmigrantsAfghanistanAfricaAlbaniaArgentinaArmeniaAsiaAustraliaAustriaBahamasBangladeshBarbadosBelarusBelgiumBelizeBoliviaBosnia and HerzegovinaBrazilBulgariaBurma/MyanmarCabo VerdeCambodiaCameroonCanadaCaribbeanCentral AmericaChileChinaColombiaCongoCosta RicaCroatiaCubaCzechoslovakiaDenmarkDominicaDominican RepublicEastern AfricaEastern AsiaEastern EuropeEcuadorEgyptEl SalvadorEnglandEritreaEthiopiaEuropeFijiFranceGermanyGhanaGreeceGrenadaGuatemalaGuyanaHaitiHondurasHong KongHungaryIndiaIndonesiaIranIraqIrelandIsraelItalyJamaicaJapanJordanKazakhstanKenyaKoreaKuwaitLaosLatin AmericaLatviaLebanonLiberiaLithuaniaMalaysiaMexicoMicronesiaMiddle AfricaMoldovaMoroccoNetherlandsNicaraguaNigeriaNorth AmericaNorth MacedoniaNorthern AfricaNorthern EuropeNorwayOceaniaPakistanPanamaPeruPhilippinesPolandPortugalRomaniaRussiaSaudi ArabiaScotlandSenegalSerbiaSierra LeoneSingaporeSomaliaSouth AfricaSouth AmericaSouth Central AsiaSouth Eastern AsiaSouthern EuropeSpainSri LankaSt. Vincent and the GrenadinesSudanSwedenSwitzerlandSyriaTaiwanThailandTrinidad and TobagoTurkeyUgandaUkraineUruguayUzbekistanVenezuelaVietnamWest IndiesWestern AfricaWestern AsiaWestern EuropeYemenZaireZimbabweAzores
Immigrants from Nepal
Race
Ancestry
AfghanAfricanAlaska NativeAlaskan AthabascanAlbanianAleutAlsatianAmericanApacheArabArapahoArgentineanArmenianAssyrian/Chaldean/SyriacAustralianAustrianBahamianBangladeshiBarbadianBasqueBelgianBelizeanBermudanBhutaneseBlackfeetBolivianBrazilianBritishBritish West IndianBurmeseCajunCambodianCanadianCape VerdeanCarpatho RusynCelticCentral AmericanCentral American IndianCherokeeCheyenneChickasawChileanChineseChippewaChoctawColombianColvilleComancheCosta RicanCreeCreekCroatianCrowCubanCypriotCzechCzechoslovakianDanishDelawareDominicanDutchDutch West IndianEastern EuropeanEcuadorianEgyptianEnglishEstonianEthiopianEuropeanFijianFilipinoFinnishFrenchFrench American IndianFrench CanadianGermanGerman RussianGhanaianGreekGuamanian/ChamorroGuatemalanGuyaneseHaitianHmongHonduranHopiHoumaHungarianIcelanderIndian (Asian)IndonesianInupiatIranianIraqiIrishIroquoisIsraeliItalianJamaicanJapaneseJordanianKenyanKiowaKoreanLaotianLatvianLebaneseLiberianLithuanianLumbeeLuxembourgerMacedonianMalaysianMalteseMarshalleseMenomineeMexicanMexican American IndianMongolianMoroccanNative HawaiianNavajoNepaleseNew ZealanderNicaraguanNigerianNorthern EuropeanNorwegianOkinawanOsageOttawaPaiutePakistaniPalestinianPanamanianParaguayanPennsylvania GermanPeruvianPimaPolishPortuguesePotawatomiPuebloPuerto RicanPuget Sound SalishRomanianRussianSalvadoranSamoanScandinavianScotch-IrishScottishSeminoleSenegaleseSerbianShoshoneSierra LeoneanSiouxSlavicSlovakSloveneSomaliSouth AfricanSouth AmericanSouth American IndianSoviet UnionSpaniardSpanishSpanish AmericanSpanish American IndianSri LankanSubsaharan AfricanSudaneseSwedishSwissSyrianTaiwaneseThaiTlingit-HaidaTohono O'OdhamTonganTrinidadian and TobagonianTsimshianTurkishU.S. Virgin IslanderUgandanUkrainianUruguayanUteVenezuelanVietnameseWelshWest IndianYakamaYaquiYugoslavianYumanYup'ikZimbabwean
Immigration
NonimmigrantsImmigrantsAfghanistanAfricaAlbaniaArgentinaArmeniaAsiaAustraliaAustriaBahamasBangladeshBarbadosBelarusBelgiumBelizeBoliviaBosnia and HerzegovinaBrazilBulgariaBurma/MyanmarCabo VerdeCambodiaCameroonCanadaCaribbeanCentral AmericaChileChinaColombiaCongoCosta RicaCroatiaCubaCzechoslovakiaDenmarkDominicaDominican RepublicEastern AfricaEastern AsiaEastern EuropeEcuadorEgyptEl SalvadorEnglandEritreaEthiopiaEuropeFijiFranceGermanyGhanaGreeceGrenadaGuatemalaGuyanaHaitiHondurasHong KongHungaryIndiaIndonesiaIranIraqIrelandIsraelItalyJamaicaJapanJordanKazakhstanKenyaKoreaKuwaitLaosLatin AmericaLatviaLebanonLiberiaLithuaniaMalaysiaMexicoMicronesiaMiddle AfricaMoldovaMoroccoNepalNetherlandsNicaraguaNigeriaNorth AmericaNorth MacedoniaNorthern AfricaNorthern EuropeNorwayOceaniaPakistanPanamaPeruPhilippinesPolandPortugalRomaniaRussiaSaudi ArabiaScotlandSenegalSerbiaSierra LeoneSingaporeSomaliaSouth AfricaSouth AmericaSouth Central AsiaSouth Eastern AsiaSouthern EuropeSpainSri LankaSt. Vincent and the GrenadinesSudanSwedenSwitzerlandSyriaTaiwanThailandTrinidad and TobagoTurkeyUgandaUkraineUruguayUzbekistanVenezuelaVietnamWest IndiesWestern AfricaWestern AsiaWestern EuropeYemenZaireZimbabweAzores
Child Poverty Under the Age of 5
Income
Poverty
Unemployment
Labor Participation
Family Structure
Vehicle Availability
Education Level
Disability

Child Poverty Under the Age of 5 Comparison

Bulgarians

Immigrants from Nepal

Exceptional
Excellent
13.9%
CHILD POVERTY UNDER THE AGE OF 5
99.9/ 100
METRIC RATING
23rd/ 347
METRIC RANK
16.6%
CHILD POVERTY UNDER THE AGE OF 5
80.3/ 100
METRIC RATING
147th/ 347
METRIC RANK

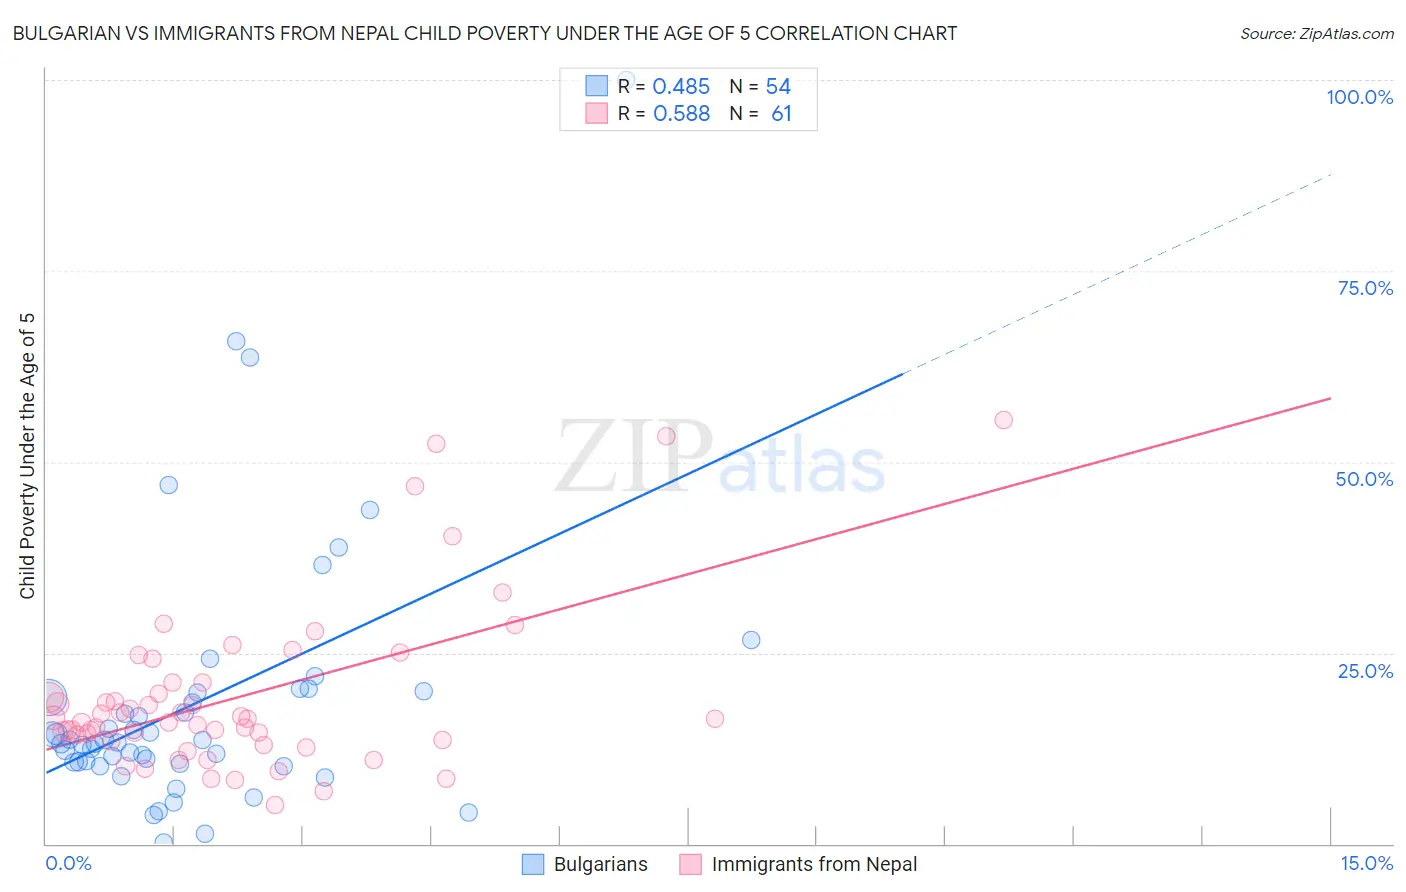
Bulgarian vs Immigrants from Nepal Child Poverty Under the Age of 5 Correlation Chart

The statistical analysis conducted on geographies consisting of 199,600,281 people shows a moderate positive correlation between the proportion of Bulgarians and poverty level among children under the age of 5 in the United States with a correlation coefficient (R) of 0.485 and weighted average of 13.9%. Similarly, the statistical analysis conducted on geographies consisting of 183,030,738 people shows a substantial positive correlation between the proportion of Immigrants from Nepal and poverty level among children under the age of 5 in the United States with a correlation coefficient (R) of 0.588 and weighted average of 16.6%, a difference of 19.5%.
Bulgarian vs Immigrants from Nepal Child Poverty Under the Age of 5

Child Poverty Under the Age of 5 Correlation Summary

MeasurementBulgarianImmigrants from Nepal
Minimum0.17%5.1%
Maximum100.0%55.6%
Range99.8%50.5%
Mean18.5%19.2%
Median13.4%16.4%
Interquartile 25% (IQ1)10.7%13.5%
Interquartile 75% (IQ3)19.8%21.2%
Interquartile Range (IQR)9.1%7.6%
Standard Deviation (Sample)17.4%10.9%
Standard Deviation (Population)17.3%10.8%

Similar Demographics by Child Poverty Under the Age of 5

Demographics Similar to Bulgarians by Child Poverty Under the Age of 5

In terms of child poverty under the age of 5, the demographic groups most similar to Bulgarians are Immigrants from Bolivia (13.8%, a difference of 0.44%), Asian (14.0%, a difference of 0.51%), Bolivian (13.8%, a difference of 0.52%), Cypriot (14.0%, a difference of 0.52%), and Immigrants from Japan (13.8%, a difference of 0.82%).
DemographicsRating | RankChild Poverty Under the Age of 5
Immigrants | Eastern Asia
100.0
/100
|
#16
Exceptional
13.5%
Assyrians/Chaldeans/Syriacs
100.0
/100
|
#17
Exceptional
13.6%
Immigrants | China
100.0
/100
|
#18
Exceptional
13.6%
Immigrants | Ireland
100.0
/100
|
#19
Exceptional
13.7%
Immigrants | Japan
100.0
/100
|
#20
Exceptional
13.8%
Bolivians
100.0
/100
|
#21
Exceptional
13.8%
Immigrants | Bolivia
100.0
/100
|
#22
Exceptional
13.8%
Bulgarians
99.9
/100
|
#23
Exceptional
13.9%
Asians
99.9
/100
|
#24
Exceptional
14.0%
Cypriots
99.9
/100
|
#25
Exceptional
14.0%
Immigrants | Lithuania
99.9
/100
|
#26
Exceptional
14.1%
Tongans
99.9
/100
|
#27
Exceptional
14.2%
Immigrants | Indonesia
99.8
/100
|
#28
Exceptional
14.3%
Immigrants | Asia
99.8
/100
|
#29
Exceptional
14.4%
Cambodians
99.8
/100
|
#30
Exceptional
14.4%

Demographics Similar to Immigrants from Nepal by Child Poverty Under the Age of 5

In terms of child poverty under the age of 5, the demographic groups most similar to Immigrants from Nepal are Syrian (16.6%, a difference of 0.19%), New Zealander (16.6%, a difference of 0.25%), Israeli (16.6%, a difference of 0.31%), Immigrants from Ethiopia (16.6%, a difference of 0.33%), and Colombian (16.7%, a difference of 0.40%).
DemographicsRating | RankChild Poverty Under the Age of 5
Guamanians/Chamorros
84.2
/100
|
#140
Excellent
16.5%
Immigrants | Western Europe
83.3
/100
|
#141
Excellent
16.5%
Portuguese
83.0
/100
|
#142
Excellent
16.5%
Samoans
83.0
/100
|
#143
Excellent
16.5%
Ethiopians
82.7
/100
|
#144
Excellent
16.5%
Immigrants | Ethiopia
82.1
/100
|
#145
Excellent
16.6%
Israelis
82.0
/100
|
#146
Excellent
16.6%
Immigrants | Nepal
80.3
/100
|
#147
Excellent
16.6%
Syrians
79.1
/100
|
#148
Good
16.6%
New Zealanders
78.7
/100
|
#149
Good
16.6%
Colombians
77.8
/100
|
#150
Good
16.7%
Canadians
77.6
/100
|
#151
Good
16.7%
Belgians
77.2
/100
|
#152
Good
16.7%
Dutch
77.1
/100
|
#153
Good
16.7%
Immigrants | Venezuela
76.0
/100
|
#154
Good
16.7%