Bulgarian vs Immigrants from Cabo Verde GED/Equivalency
COMPARE
Bulgarian
Immigrants from Cabo Verde
GED/Equivalency
GED/Equivalency Comparison
Bulgarians
Immigrants from Cabo Verde
89.0%
GED/EQUIVALENCY
99.9/ 100
METRIC RATING
11th/ 347
METRIC RANK
78.9%
GED/EQUIVALENCY
0.0/ 100
METRIC RATING
330th/ 347
METRIC RANK
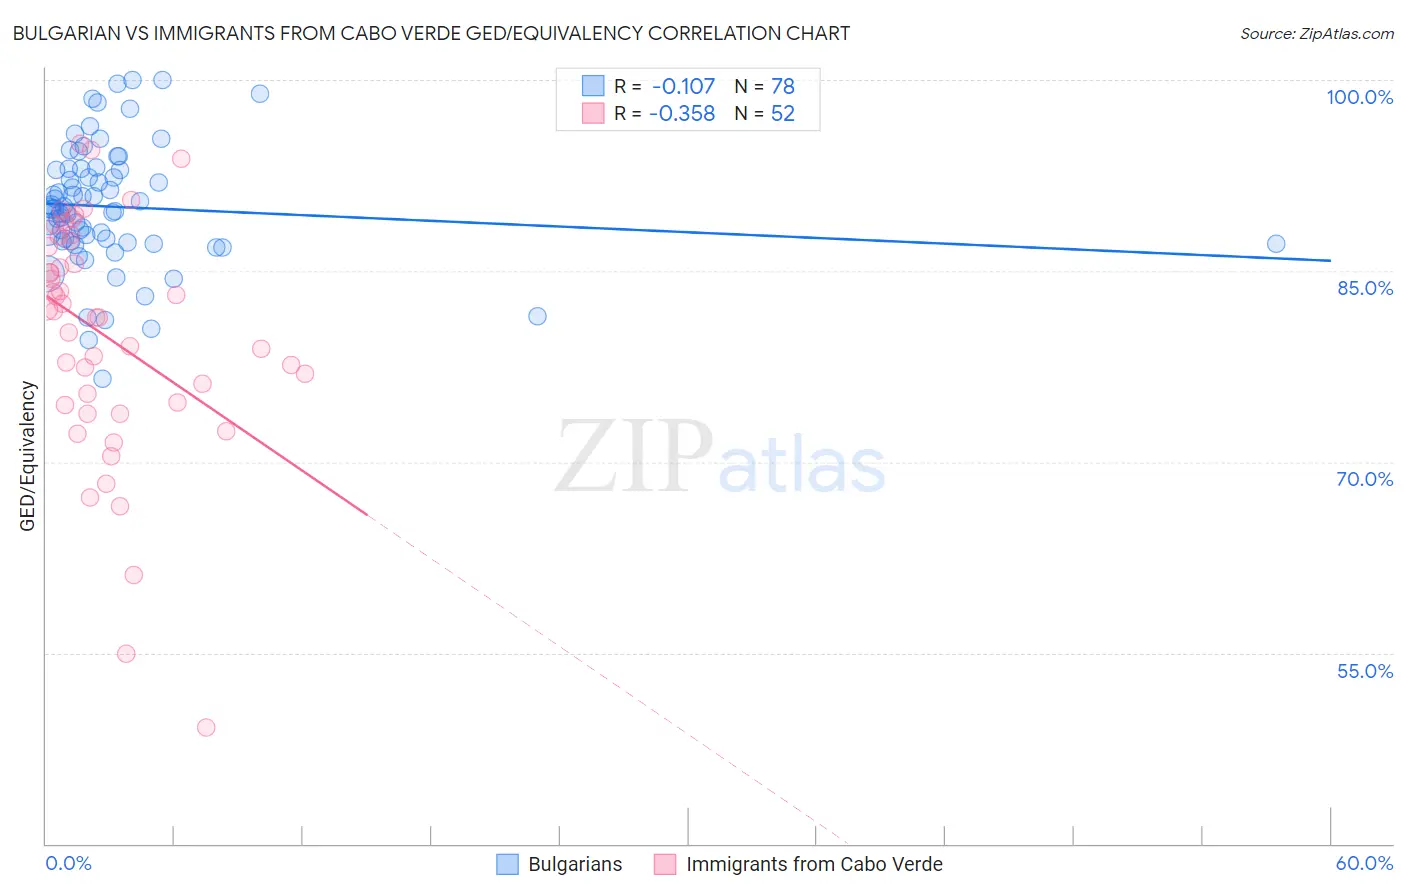
Bulgarian vs Immigrants from Cabo Verde GED/Equivalency Correlation Chart
The statistical analysis conducted on geographies consisting of 205,633,746 people shows a poor negative correlation between the proportion of Bulgarians and percentage of population with at least ged/equivalency education in the United States with a correlation coefficient (R) of -0.107 and weighted average of 89.0%. Similarly, the statistical analysis conducted on geographies consisting of 38,158,504 people shows a mild negative correlation between the proportion of Immigrants from Cabo Verde and percentage of population with at least ged/equivalency education in the United States with a correlation coefficient (R) of -0.358 and weighted average of 78.9%, a difference of 12.7%.
GED/Equivalency Correlation Summary
| Measurement | Bulgarian | Immigrants from Cabo Verde |
| Minimum | 76.5% | 49.2% |
| Maximum | 100.0% | 95.0% |
| Range | 23.5% | 45.8% |
| Mean | 90.0% | 79.9% |
| Median | 89.9% | 81.6% |
| Interquartile 25% (IQ1) | 87.3% | 74.6% |
| Interquartile 75% (IQ3) | 93.0% | 87.1% |
| Interquartile Range (IQR) | 5.6% | 12.6% |
| Standard Deviation (Sample) | 4.8% | 9.5% |
| Standard Deviation (Population) | 4.8% | 9.4% |
Similar Demographics by GED/Equivalency
Demographics Similar to Bulgarians by GED/Equivalency
In terms of ged/equivalency, the demographic groups most similar to Bulgarians are Norwegian (89.0%, a difference of 0.040%), Lithuanian (88.9%, a difference of 0.040%), Immigrants from Iran (88.9%, a difference of 0.050%), Chinese (89.0%, a difference of 0.080%), and Cypriot (88.9%, a difference of 0.080%).
| Demographics | Rating | Rank | GED/Equivalency |
| Iranians | 100.0 /100 | #4 | Exceptional 89.2% |
| Latvians | 100.0 /100 | #5 | Exceptional 89.2% |
| Thais | 100.0 /100 | #6 | Exceptional 89.1% |
| Eastern Europeans | 99.9 /100 | #7 | Exceptional 89.1% |
| Carpatho Rusyns | 99.9 /100 | #8 | Exceptional 89.1% |
| Chinese | 99.9 /100 | #9 | Exceptional 89.0% |
| Norwegians | 99.9 /100 | #10 | Exceptional 89.0% |
| Bulgarians | 99.9 /100 | #11 | Exceptional 89.0% |
| Lithuanians | 99.9 /100 | #12 | Exceptional 88.9% |
| Immigrants | Iran | 99.9 /100 | #13 | Exceptional 88.9% |
| Cypriots | 99.9 /100 | #14 | Exceptional 88.9% |
| Okinawans | 99.9 /100 | #15 | Exceptional 88.9% |
| Immigrants | Taiwan | 99.9 /100 | #16 | Exceptional 88.8% |
| Croatians | 99.9 /100 | #17 | Exceptional 88.8% |
| Slovenes | 99.9 /100 | #18 | Exceptional 88.8% |
Demographics Similar to Immigrants from Cabo Verde by GED/Equivalency
In terms of ged/equivalency, the demographic groups most similar to Immigrants from Cabo Verde are Dominican (79.1%, a difference of 0.16%), Hispanic or Latino (79.1%, a difference of 0.20%), Immigrants from Honduras (78.7%, a difference of 0.24%), Central American (79.2%, a difference of 0.31%), and Yuman (79.2%, a difference of 0.33%).
| Demographics | Rating | Rank | GED/Equivalency |
| Immigrants | Nicaragua | 0.0 /100 | #323 | Tragic 79.9% |
| Mexican American Indians | 0.0 /100 | #324 | Tragic 79.4% |
| Hondurans | 0.0 /100 | #325 | Tragic 79.3% |
| Yuman | 0.0 /100 | #326 | Tragic 79.2% |
| Central Americans | 0.0 /100 | #327 | Tragic 79.2% |
| Hispanics or Latinos | 0.0 /100 | #328 | Tragic 79.1% |
| Dominicans | 0.0 /100 | #329 | Tragic 79.1% |
| Immigrants | Cabo Verde | 0.0 /100 | #330 | Tragic 78.9% |
| Immigrants | Honduras | 0.0 /100 | #331 | Tragic 78.7% |
| Immigrants | Azores | 0.0 /100 | #332 | Tragic 78.7% |
| Salvadorans | 0.0 /100 | #333 | Tragic 78.6% |
| Guatemalans | 0.0 /100 | #334 | Tragic 78.5% |
| Immigrants | Latin America | 0.0 /100 | #335 | Tragic 78.5% |
| Immigrants | Dominican Republic | 0.0 /100 | #336 | Tragic 78.0% |
| Immigrants | Yemen | 0.0 /100 | #337 | Tragic 77.9% |