Basque vs Immigrants from Jordan Bachelor's Degree
COMPARE
Basque
Immigrants from Jordan
Bachelor's Degree
Bachelor's Degree Comparison
Basques
Immigrants from Jordan
37.7%
BACHELOR'S DEGREE
47.4/ 100
METRIC RATING
177th/ 347
METRIC RANK
40.3%
BACHELOR'S DEGREE
93.4/ 100
METRIC RATING
127th/ 347
METRIC RANK
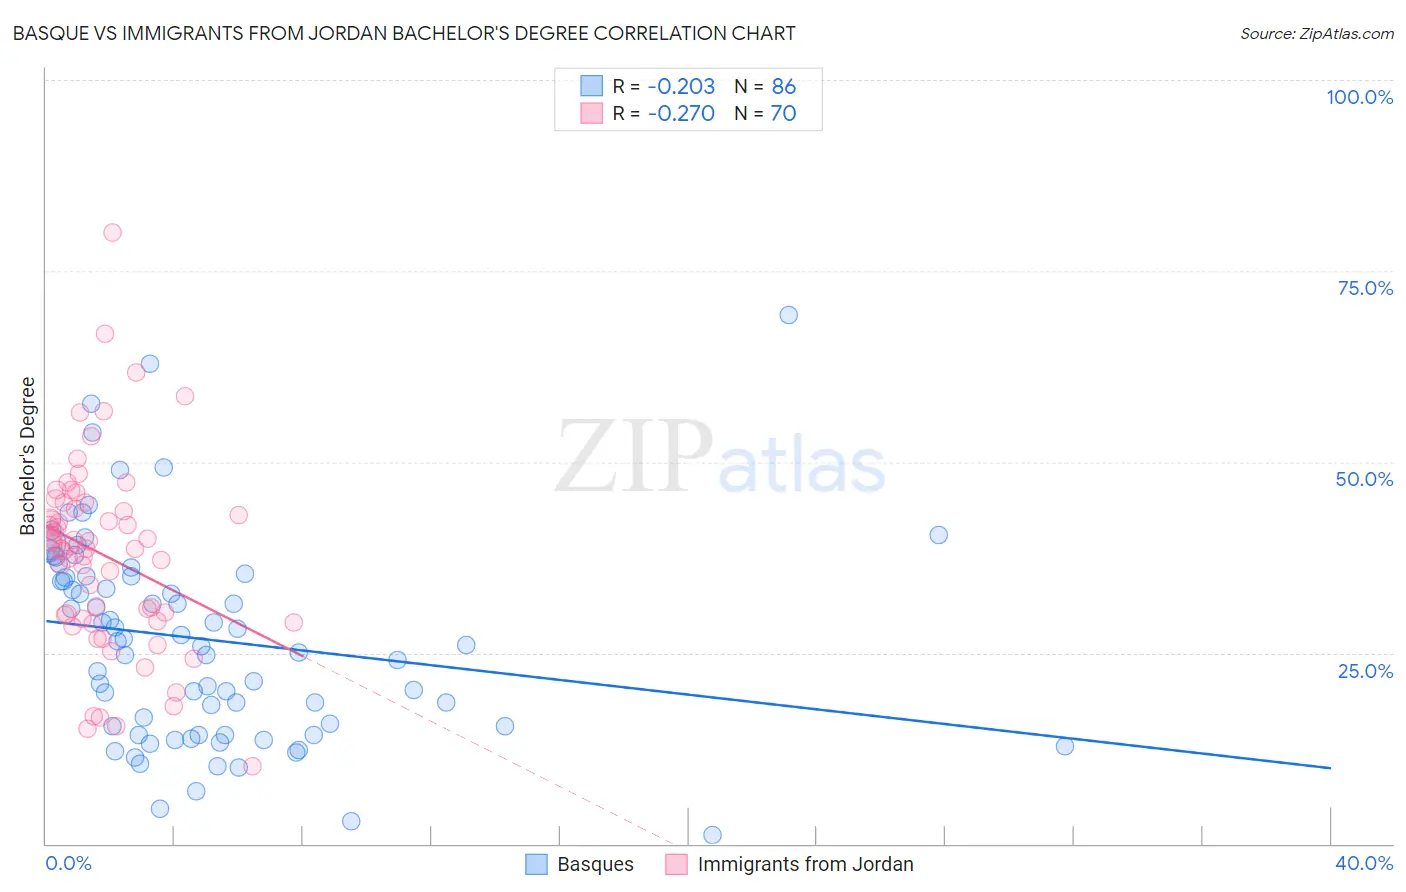
Basque vs Immigrants from Jordan Bachelor's Degree Correlation Chart
The statistical analysis conducted on geographies consisting of 165,778,138 people shows a weak negative correlation between the proportion of Basques and percentage of population with at least bachelor's degree education in the United States with a correlation coefficient (R) of -0.203 and weighted average of 37.7%. Similarly, the statistical analysis conducted on geographies consisting of 181,275,733 people shows a weak negative correlation between the proportion of Immigrants from Jordan and percentage of population with at least bachelor's degree education in the United States with a correlation coefficient (R) of -0.270 and weighted average of 40.3%, a difference of 6.7%.
Bachelor's Degree Correlation Summary
| Measurement | Basque | Immigrants from Jordan |
| Minimum | 1.2% | 10.2% |
| Maximum | 69.2% | 80.0% |
| Range | 68.0% | 69.8% |
| Mean | 26.8% | 37.8% |
| Median | 26.3% | 38.8% |
| Interquartile 25% (IQ1) | 15.4% | 29.5% |
| Interquartile 75% (IQ3) | 35.0% | 43.8% |
| Interquartile Range (IQR) | 19.7% | 14.3% |
| Standard Deviation (Sample) | 13.5% | 12.4% |
| Standard Deviation (Population) | 13.4% | 12.4% |
Similar Demographics by Bachelor's Degree
Demographics Similar to Basques by Bachelor's Degree
In terms of bachelor's degree, the demographic groups most similar to Basques are Costa Rican (37.7%, a difference of 0.020%), Immigrants from Cameroon (37.7%, a difference of 0.060%), Immigrants from Uruguay (37.8%, a difference of 0.090%), Immigrants from Colombia (37.7%, a difference of 0.19%), and Immigrants from Bangladesh (37.8%, a difference of 0.25%).
| Demographics | Rating | Rank | Bachelor's Degree |
| Czechs | 54.4 /100 | #170 | Average 38.0% |
| Bermudans | 54.2 /100 | #171 | Average 38.0% |
| Immigrants | Somalia | 52.8 /100 | #172 | Average 37.9% |
| Immigrants | Iraq | 52.5 /100 | #173 | Average 37.9% |
| Immigrants | Bangladesh | 50.0 /100 | #174 | Average 37.8% |
| Immigrants | Uruguay | 48.3 /100 | #175 | Average 37.8% |
| Costa Ricans | 47.6 /100 | #176 | Average 37.7% |
| Basques | 47.4 /100 | #177 | Average 37.7% |
| Immigrants | Cameroon | 46.8 /100 | #178 | Average 37.7% |
| Immigrants | Colombia | 45.4 /100 | #179 | Average 37.7% |
| Irish | 44.3 /100 | #180 | Average 37.6% |
| Immigrants | Senegal | 43.8 /100 | #181 | Average 37.6% |
| Immigrants | Bosnia and Herzegovina | 43.4 /100 | #182 | Average 37.6% |
| Senegalese | 42.2 /100 | #183 | Average 37.5% |
| Scandinavians | 41.7 /100 | #184 | Average 37.5% |
Demographics Similar to Immigrants from Jordan by Bachelor's Degree
In terms of bachelor's degree, the demographic groups most similar to Immigrants from Jordan are Immigrants from Venezuela (40.2%, a difference of 0.17%), Immigrants from Eastern Africa (40.4%, a difference of 0.28%), British (40.4%, a difference of 0.33%), Serbian (40.1%, a difference of 0.35%), and Immigrants from Eritrea (40.4%, a difference of 0.36%).
| Demographics | Rating | Rank | Bachelor's Degree |
| Venezuelans | 94.7 /100 | #120 | Exceptional 40.5% |
| Moroccans | 94.6 /100 | #121 | Exceptional 40.5% |
| Immigrants | Albania | 94.4 /100 | #122 | Exceptional 40.4% |
| Lebanese | 94.3 /100 | #123 | Exceptional 40.4% |
| Immigrants | Eritrea | 94.3 /100 | #124 | Exceptional 40.4% |
| British | 94.2 /100 | #125 | Exceptional 40.4% |
| Immigrants | Eastern Africa | 94.1 /100 | #126 | Exceptional 40.4% |
| Immigrants | Jordan | 93.4 /100 | #127 | Exceptional 40.3% |
| Immigrants | Venezuela | 92.9 /100 | #128 | Exceptional 40.2% |
| Serbians | 92.4 /100 | #129 | Exceptional 40.1% |
| Sierra Leoneans | 92.2 /100 | #130 | Exceptional 40.1% |
| Italians | 91.9 /100 | #131 | Exceptional 40.1% |
| Taiwanese | 91.1 /100 | #132 | Exceptional 40.0% |
| Immigrants | Southern Europe | 91.1 /100 | #133 | Exceptional 40.0% |
| Assyrians/Chaldeans/Syriacs | 89.4 /100 | #134 | Excellent 39.8% |