Basque vs Brazilian Bachelor's Degree
COMPARE
Basque
Brazilian
Bachelor's Degree
Bachelor's Degree Comparison
Basques
Brazilians
37.7%
BACHELOR'S DEGREE
47.4/ 100
METRIC RATING
177th/ 347
METRIC RANK
40.8%
BACHELOR'S DEGREE
96.3/ 100
METRIC RATING
113th/ 347
METRIC RANK
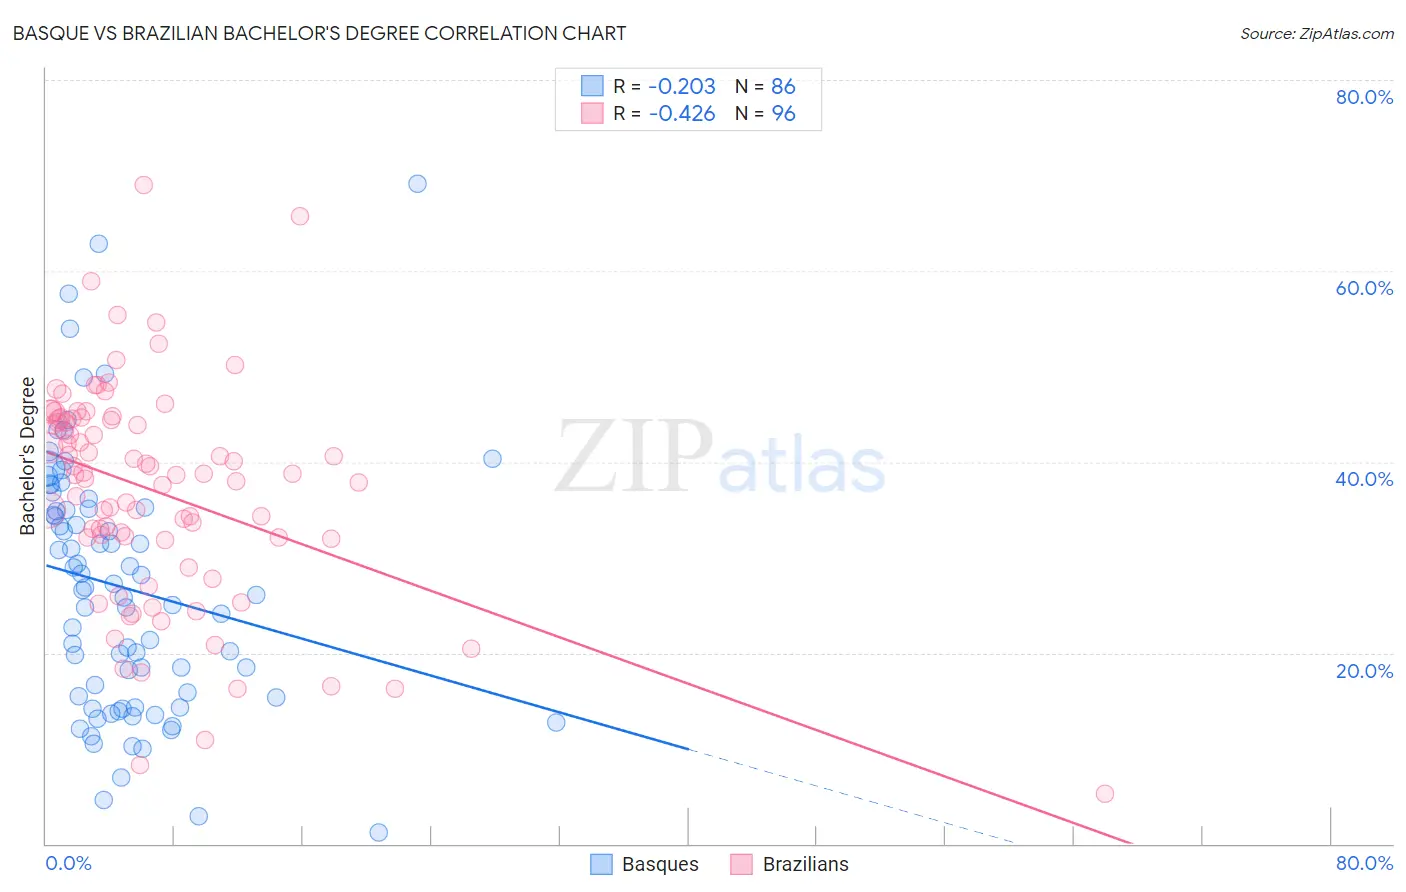
Basque vs Brazilian Bachelor's Degree Correlation Chart
The statistical analysis conducted on geographies consisting of 165,778,138 people shows a weak negative correlation between the proportion of Basques and percentage of population with at least bachelor's degree education in the United States with a correlation coefficient (R) of -0.203 and weighted average of 37.7%. Similarly, the statistical analysis conducted on geographies consisting of 323,923,782 people shows a moderate negative correlation between the proportion of Brazilians and percentage of population with at least bachelor's degree education in the United States with a correlation coefficient (R) of -0.426 and weighted average of 40.8%, a difference of 8.2%.
Bachelor's Degree Correlation Summary
| Measurement | Basque | Brazilian |
| Minimum | 1.2% | 5.3% |
| Maximum | 69.2% | 69.0% |
| Range | 68.0% | 63.7% |
| Mean | 26.8% | 36.9% |
| Median | 26.3% | 38.6% |
| Interquartile 25% (IQ1) | 15.4% | 32.0% |
| Interquartile 75% (IQ3) | 35.0% | 44.5% |
| Interquartile Range (IQR) | 19.7% | 12.5% |
| Standard Deviation (Sample) | 13.5% | 11.5% |
| Standard Deviation (Population) | 13.4% | 11.4% |
Similar Demographics by Bachelor's Degree
Demographics Similar to Basques by Bachelor's Degree
In terms of bachelor's degree, the demographic groups most similar to Basques are Costa Rican (37.7%, a difference of 0.020%), Immigrants from Cameroon (37.7%, a difference of 0.060%), Immigrants from Uruguay (37.8%, a difference of 0.090%), Immigrants from Colombia (37.7%, a difference of 0.19%), and Immigrants from Bangladesh (37.8%, a difference of 0.25%).
| Demographics | Rating | Rank | Bachelor's Degree |
| Czechs | 54.4 /100 | #170 | Average 38.0% |
| Bermudans | 54.2 /100 | #171 | Average 38.0% |
| Immigrants | Somalia | 52.8 /100 | #172 | Average 37.9% |
| Immigrants | Iraq | 52.5 /100 | #173 | Average 37.9% |
| Immigrants | Bangladesh | 50.0 /100 | #174 | Average 37.8% |
| Immigrants | Uruguay | 48.3 /100 | #175 | Average 37.8% |
| Costa Ricans | 47.6 /100 | #176 | Average 37.7% |
| Basques | 47.4 /100 | #177 | Average 37.7% |
| Immigrants | Cameroon | 46.8 /100 | #178 | Average 37.7% |
| Immigrants | Colombia | 45.4 /100 | #179 | Average 37.7% |
| Irish | 44.3 /100 | #180 | Average 37.6% |
| Immigrants | Senegal | 43.8 /100 | #181 | Average 37.6% |
| Immigrants | Bosnia and Herzegovina | 43.4 /100 | #182 | Average 37.6% |
| Senegalese | 42.2 /100 | #183 | Average 37.5% |
| Scandinavians | 41.7 /100 | #184 | Average 37.5% |
Demographics Similar to Brazilians by Bachelor's Degree
In terms of bachelor's degree, the demographic groups most similar to Brazilians are Afghan (40.8%, a difference of 0.030%), Ugandan (40.8%, a difference of 0.040%), Immigrants from Chile (40.8%, a difference of 0.090%), Albanian (40.9%, a difference of 0.14%), and Arab (40.9%, a difference of 0.21%).
| Demographics | Rating | Rank | Bachelor's Degree |
| Alsatians | 97.0 /100 | #106 | Exceptional 41.0% |
| Northern Europeans | 96.8 /100 | #107 | Exceptional 41.0% |
| Ukrainians | 96.6 /100 | #108 | Exceptional 40.9% |
| Arabs | 96.6 /100 | #109 | Exceptional 40.9% |
| Albanians | 96.5 /100 | #110 | Exceptional 40.9% |
| Immigrants | Chile | 96.4 /100 | #111 | Exceptional 40.8% |
| Ugandans | 96.3 /100 | #112 | Exceptional 40.8% |
| Brazilians | 96.3 /100 | #113 | Exceptional 40.8% |
| Afghans | 96.2 /100 | #114 | Exceptional 40.8% |
| Palestinians | 95.8 /100 | #115 | Exceptional 40.7% |
| Immigrants | Uganda | 95.7 /100 | #116 | Exceptional 40.7% |
| Austrians | 95.5 /100 | #117 | Exceptional 40.6% |
| Croatians | 95.5 /100 | #118 | Exceptional 40.6% |
| Immigrants | Syria | 94.9 /100 | #119 | Exceptional 40.5% |
| Venezuelans | 94.7 /100 | #120 | Exceptional 40.5% |