Basque vs Immigrants from Mexico Bachelor's Degree
COMPARE
Basque
Immigrants from Mexico
Bachelor's Degree
Bachelor's Degree Comparison
Basques
Immigrants from Mexico
37.7%
BACHELOR'S DEGREE
47.4/ 100
METRIC RATING
177th/ 347
METRIC RANK
26.1%
BACHELOR'S DEGREE
0.0/ 100
METRIC RATING
336th/ 347
METRIC RANK
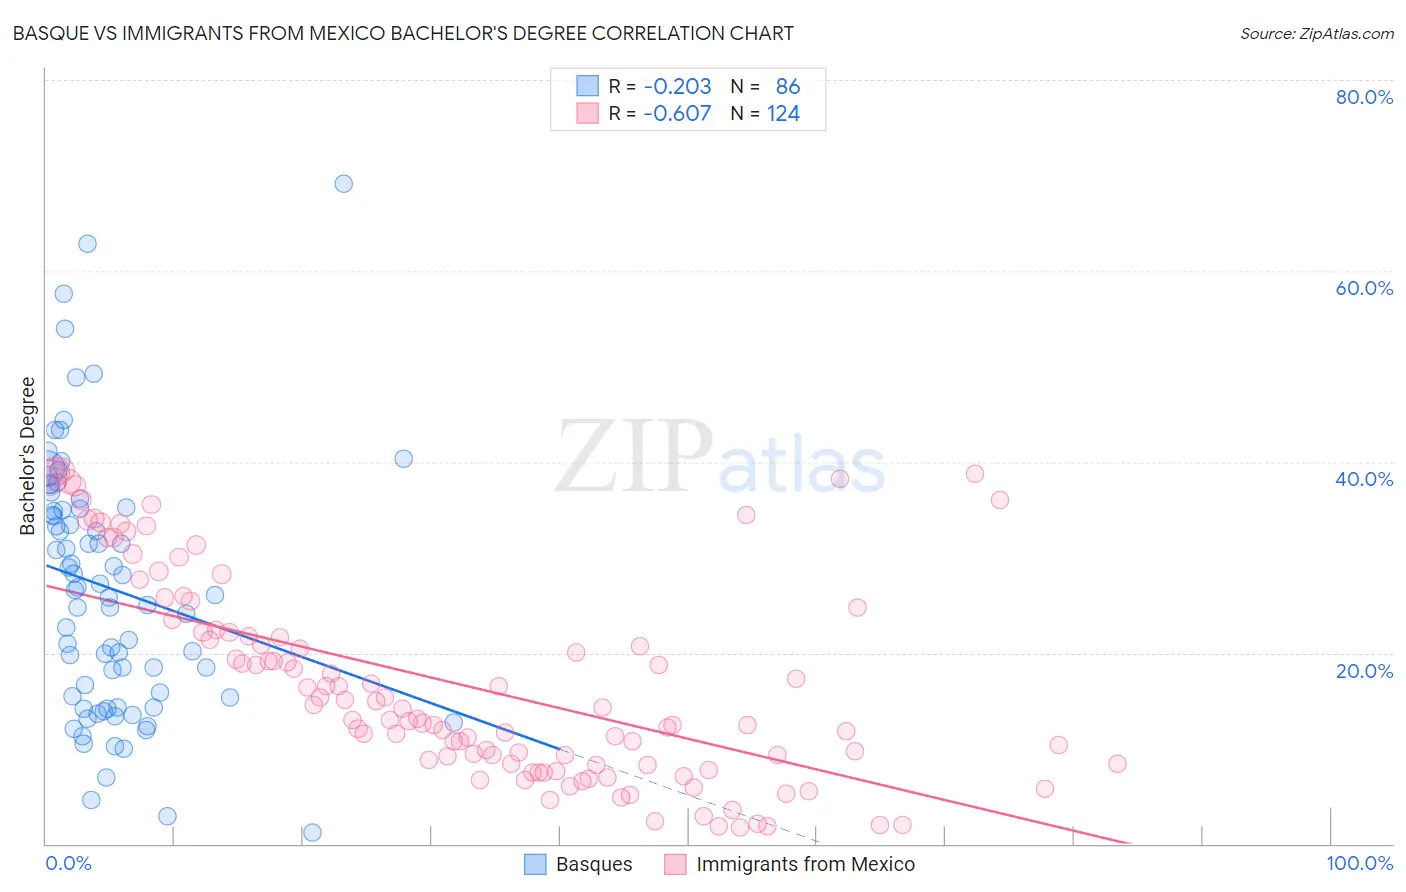
Basque vs Immigrants from Mexico Bachelor's Degree Correlation Chart
The statistical analysis conducted on geographies consisting of 165,778,138 people shows a weak negative correlation between the proportion of Basques and percentage of population with at least bachelor's degree education in the United States with a correlation coefficient (R) of -0.203 and weighted average of 37.7%. Similarly, the statistical analysis conducted on geographies consisting of 513,639,640 people shows a significant negative correlation between the proportion of Immigrants from Mexico and percentage of population with at least bachelor's degree education in the United States with a correlation coefficient (R) of -0.607 and weighted average of 26.1%, a difference of 44.3%.
Bachelor's Degree Correlation Summary
| Measurement | Basque | Immigrants from Mexico |
| Minimum | 1.2% | 1.8% |
| Maximum | 69.2% | 39.1% |
| Range | 68.0% | 37.4% |
| Mean | 26.8% | 16.7% |
| Median | 26.3% | 13.6% |
| Interquartile 25% (IQ1) | 15.4% | 8.4% |
| Interquartile 75% (IQ3) | 35.0% | 22.3% |
| Interquartile Range (IQR) | 19.7% | 13.9% |
| Standard Deviation (Sample) | 13.5% | 10.6% |
| Standard Deviation (Population) | 13.4% | 10.5% |
Similar Demographics by Bachelor's Degree
Demographics Similar to Basques by Bachelor's Degree
In terms of bachelor's degree, the demographic groups most similar to Basques are Costa Rican (37.7%, a difference of 0.020%), Immigrants from Cameroon (37.7%, a difference of 0.060%), Immigrants from Uruguay (37.8%, a difference of 0.090%), Immigrants from Colombia (37.7%, a difference of 0.19%), and Immigrants from Bangladesh (37.8%, a difference of 0.25%).
| Demographics | Rating | Rank | Bachelor's Degree |
| Czechs | 54.4 /100 | #170 | Average 38.0% |
| Bermudans | 54.2 /100 | #171 | Average 38.0% |
| Immigrants | Somalia | 52.8 /100 | #172 | Average 37.9% |
| Immigrants | Iraq | 52.5 /100 | #173 | Average 37.9% |
| Immigrants | Bangladesh | 50.0 /100 | #174 | Average 37.8% |
| Immigrants | Uruguay | 48.3 /100 | #175 | Average 37.8% |
| Costa Ricans | 47.6 /100 | #176 | Average 37.7% |
| Basques | 47.4 /100 | #177 | Average 37.7% |
| Immigrants | Cameroon | 46.8 /100 | #178 | Average 37.7% |
| Immigrants | Colombia | 45.4 /100 | #179 | Average 37.7% |
| Irish | 44.3 /100 | #180 | Average 37.6% |
| Immigrants | Senegal | 43.8 /100 | #181 | Average 37.6% |
| Immigrants | Bosnia and Herzegovina | 43.4 /100 | #182 | Average 37.6% |
| Senegalese | 42.2 /100 | #183 | Average 37.5% |
| Scandinavians | 41.7 /100 | #184 | Average 37.5% |
Demographics Similar to Immigrants from Mexico by Bachelor's Degree
In terms of bachelor's degree, the demographic groups most similar to Immigrants from Mexico are Native/Alaskan (26.3%, a difference of 0.70%), Inupiat (25.8%, a difference of 1.3%), Arapaho (26.6%, a difference of 1.9%), Pueblo (25.5%, a difference of 2.4%), and Hopi (25.3%, a difference of 3.3%).
| Demographics | Rating | Rank | Bachelor's Degree |
| Immigrants | Central America | 0.0 /100 | #329 | Tragic 27.5% |
| Spanish American Indians | 0.0 /100 | #330 | Tragic 27.5% |
| Immigrants | Azores | 0.0 /100 | #331 | Tragic 27.3% |
| Menominee | 0.0 /100 | #332 | Tragic 27.3% |
| Mexicans | 0.0 /100 | #333 | Tragic 27.1% |
| Arapaho | 0.0 /100 | #334 | Tragic 26.6% |
| Natives/Alaskans | 0.0 /100 | #335 | Tragic 26.3% |
| Immigrants | Mexico | 0.0 /100 | #336 | Tragic 26.1% |
| Inupiat | 0.0 /100 | #337 | Tragic 25.8% |
| Pueblo | 0.0 /100 | #338 | Tragic 25.5% |
| Hopi | 0.0 /100 | #339 | Tragic 25.3% |
| Lumbee | 0.0 /100 | #340 | Tragic 24.8% |
| Yuman | 0.0 /100 | #341 | Tragic 24.5% |
| Yakama | 0.0 /100 | #342 | Tragic 24.5% |
| Tohono O'odham | 0.0 /100 | #343 | Tragic 24.4% |