Basque vs Czechoslovakian Bachelor's Degree
COMPARE
Basque
Czechoslovakian
Bachelor's Degree
Bachelor's Degree Comparison
Basques
Czechoslovakians
37.7%
BACHELOR'S DEGREE
47.4/ 100
METRIC RATING
177th/ 347
METRIC RANK
37.0%
BACHELOR'S DEGREE
29.2/ 100
METRIC RATING
197th/ 347
METRIC RANK
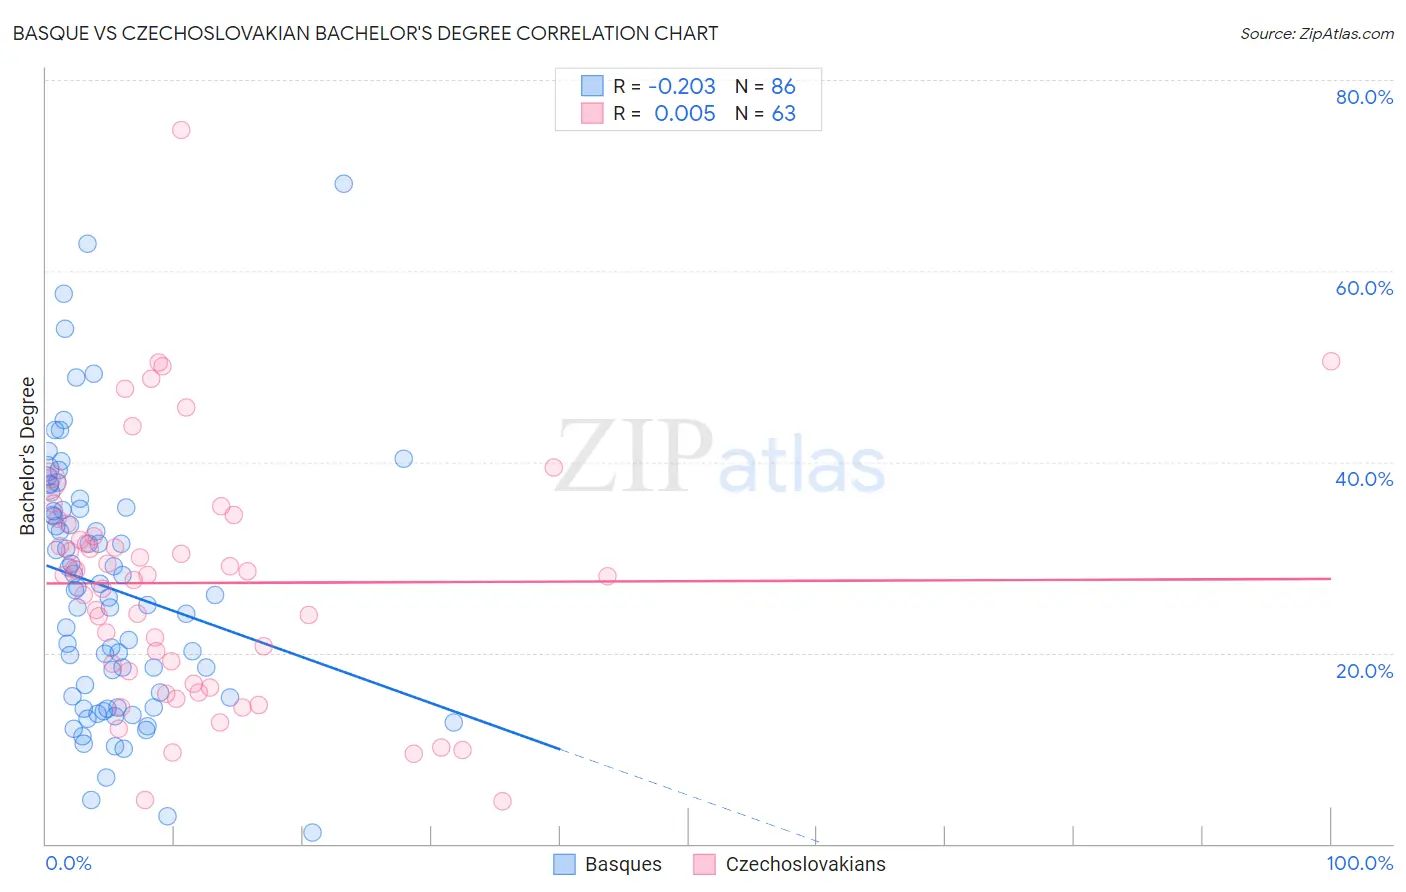
Basque vs Czechoslovakian Bachelor's Degree Correlation Chart
The statistical analysis conducted on geographies consisting of 165,778,138 people shows a weak negative correlation between the proportion of Basques and percentage of population with at least bachelor's degree education in the United States with a correlation coefficient (R) of -0.203 and weighted average of 37.7%. Similarly, the statistical analysis conducted on geographies consisting of 368,656,167 people shows no correlation between the proportion of Czechoslovakians and percentage of population with at least bachelor's degree education in the United States with a correlation coefficient (R) of 0.005 and weighted average of 37.0%, a difference of 1.9%.
Bachelor's Degree Correlation Summary
| Measurement | Basque | Czechoslovakian |
| Minimum | 1.2% | 4.4% |
| Maximum | 69.2% | 74.8% |
| Range | 68.0% | 70.3% |
| Mean | 26.8% | 27.3% |
| Median | 26.3% | 28.1% |
| Interquartile 25% (IQ1) | 15.4% | 16.8% |
| Interquartile 75% (IQ3) | 35.0% | 33.5% |
| Interquartile Range (IQR) | 19.7% | 16.8% |
| Standard Deviation (Sample) | 13.5% | 13.0% |
| Standard Deviation (Population) | 13.4% | 12.9% |
Demographics Similar to Basques and Czechoslovakians by Bachelor's Degree
In terms of bachelor's degree, the demographic groups most similar to Basques are Immigrants from Cameroon (37.7%, a difference of 0.060%), Immigrants from Colombia (37.7%, a difference of 0.19%), Irish (37.6%, a difference of 0.30%), Immigrants from Senegal (37.6%, a difference of 0.35%), and Immigrants from Bosnia and Herzegovina (37.6%, a difference of 0.39%). Similarly, the demographic groups most similar to Czechoslovakians are Celtic (37.0%, a difference of 0.040%), Korean (37.0%, a difference of 0.070%), Belgian (37.0%, a difference of 0.090%), Yugoslavian (37.1%, a difference of 0.28%), and Immigrants from Vietnam (37.1%, a difference of 0.34%).
| Demographics | Rating | Rank | Bachelor's Degree |
| Basques | 47.4 /100 | #177 | Average 37.7% |
| Immigrants | Cameroon | 46.8 /100 | #178 | Average 37.7% |
| Immigrants | Colombia | 45.4 /100 | #179 | Average 37.7% |
| Irish | 44.3 /100 | #180 | Average 37.6% |
| Immigrants | Senegal | 43.8 /100 | #181 | Average 37.6% |
| Immigrants | Bosnia and Herzegovina | 43.4 /100 | #182 | Average 37.6% |
| Senegalese | 42.2 /100 | #183 | Average 37.5% |
| Scandinavians | 41.7 /100 | #184 | Average 37.5% |
| Immigrants | Peru | 41.3 /100 | #185 | Average 37.5% |
| Norwegians | 40.4 /100 | #186 | Average 37.5% |
| English | 39.7 /100 | #187 | Fair 37.4% |
| Immigrants | Oceania | 37.3 /100 | #188 | Fair 37.3% |
| Slovaks | 36.9 /100 | #189 | Fair 37.3% |
| Swiss | 34.1 /100 | #190 | Fair 37.2% |
| Nigerians | 33.9 /100 | #191 | Fair 37.2% |
| Immigrants | Vietnam | 32.1 /100 | #192 | Fair 37.1% |
| Yugoslavians | 31.5 /100 | #193 | Fair 37.1% |
| Belgians | 29.9 /100 | #194 | Fair 37.0% |
| Koreans | 29.8 /100 | #195 | Fair 37.0% |
| Celtics | 29.5 /100 | #196 | Fair 37.0% |
| Czechoslovakians | 29.2 /100 | #197 | Fair 37.0% |