Basque vs Welsh Bachelor's Degree
COMPARE
Basque
Welsh
Bachelor's Degree
Bachelor's Degree Comparison
Basques
Welsh
37.7%
BACHELOR'S DEGREE
47.4/ 100
METRIC RATING
177th/ 347
METRIC RANK
37.0%
BACHELOR'S DEGREE
29.1/ 100
METRIC RATING
198th/ 347
METRIC RANK
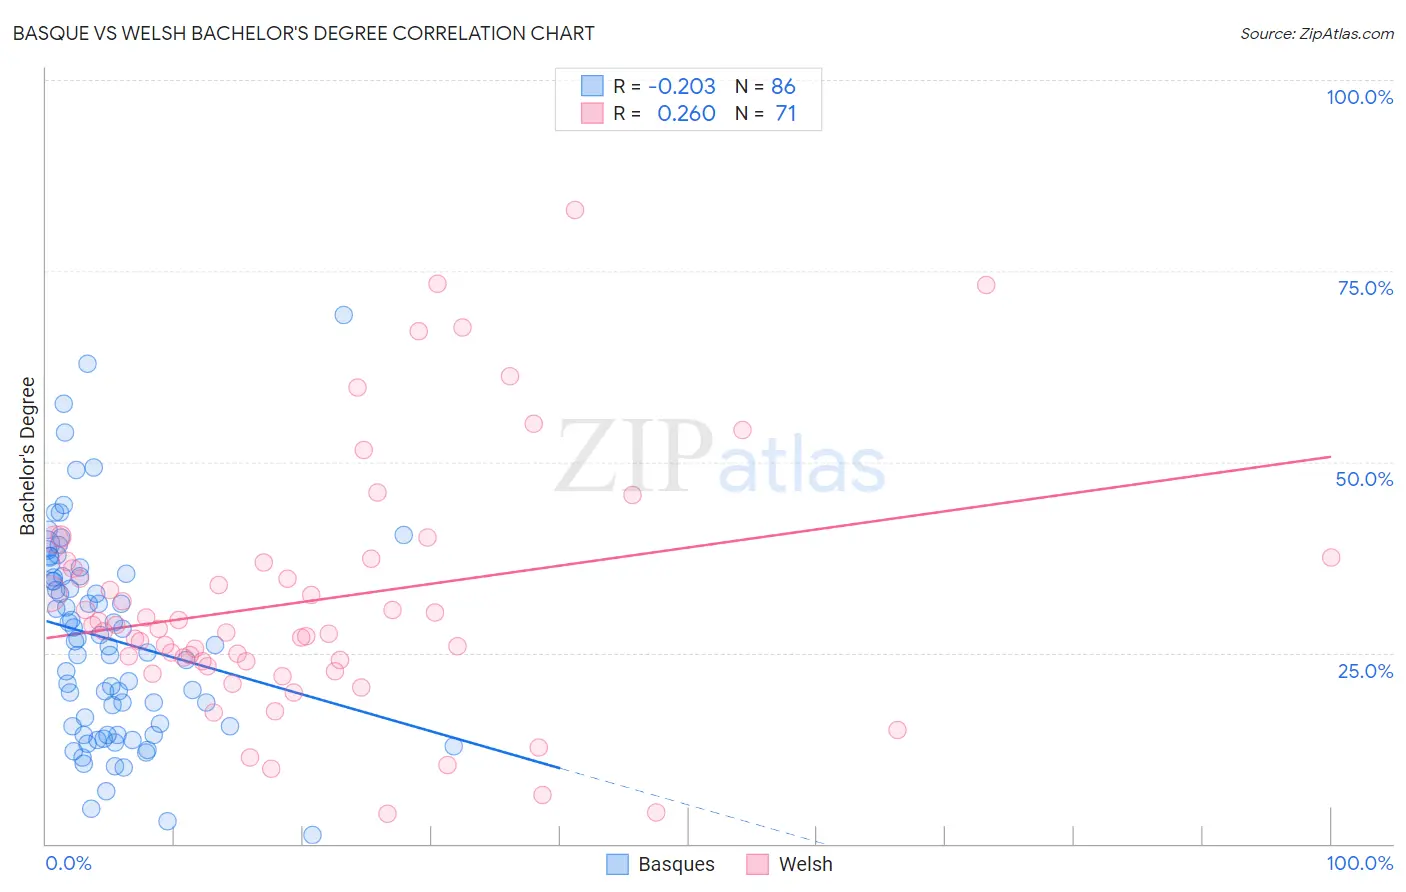
Basque vs Welsh Bachelor's Degree Correlation Chart
The statistical analysis conducted on geographies consisting of 165,778,138 people shows a weak negative correlation between the proportion of Basques and percentage of population with at least bachelor's degree education in the United States with a correlation coefficient (R) of -0.203 and weighted average of 37.7%. Similarly, the statistical analysis conducted on geographies consisting of 528,521,285 people shows a weak positive correlation between the proportion of Welsh and percentage of population with at least bachelor's degree education in the United States with a correlation coefficient (R) of 0.260 and weighted average of 37.0%, a difference of 1.9%.
Bachelor's Degree Correlation Summary
| Measurement | Basque | Welsh |
| Minimum | 1.2% | 3.9% |
| Maximum | 69.2% | 83.0% |
| Range | 68.0% | 79.1% |
| Mean | 26.8% | 31.9% |
| Median | 26.3% | 28.2% |
| Interquartile 25% (IQ1) | 15.4% | 23.9% |
| Interquartile 75% (IQ3) | 35.0% | 36.9% |
| Interquartile Range (IQR) | 19.7% | 13.0% |
| Standard Deviation (Sample) | 13.5% | 16.3% |
| Standard Deviation (Population) | 13.4% | 16.2% |
Similar Demographics by Bachelor's Degree
Demographics Similar to Basques by Bachelor's Degree
In terms of bachelor's degree, the demographic groups most similar to Basques are Costa Rican (37.7%, a difference of 0.020%), Immigrants from Cameroon (37.7%, a difference of 0.060%), Immigrants from Uruguay (37.8%, a difference of 0.090%), Immigrants from Colombia (37.7%, a difference of 0.19%), and Immigrants from Bangladesh (37.8%, a difference of 0.25%).
| Demographics | Rating | Rank | Bachelor's Degree |
| Czechs | 54.4 /100 | #170 | Average 38.0% |
| Bermudans | 54.2 /100 | #171 | Average 38.0% |
| Immigrants | Somalia | 52.8 /100 | #172 | Average 37.9% |
| Immigrants | Iraq | 52.5 /100 | #173 | Average 37.9% |
| Immigrants | Bangladesh | 50.0 /100 | #174 | Average 37.8% |
| Immigrants | Uruguay | 48.3 /100 | #175 | Average 37.8% |
| Costa Ricans | 47.6 /100 | #176 | Average 37.7% |
| Basques | 47.4 /100 | #177 | Average 37.7% |
| Immigrants | Cameroon | 46.8 /100 | #178 | Average 37.7% |
| Immigrants | Colombia | 45.4 /100 | #179 | Average 37.7% |
| Irish | 44.3 /100 | #180 | Average 37.6% |
| Immigrants | Senegal | 43.8 /100 | #181 | Average 37.6% |
| Immigrants | Bosnia and Herzegovina | 43.4 /100 | #182 | Average 37.6% |
| Senegalese | 42.2 /100 | #183 | Average 37.5% |
| Scandinavians | 41.7 /100 | #184 | Average 37.5% |
Demographics Similar to Welsh by Bachelor's Degree
In terms of bachelor's degree, the demographic groups most similar to Welsh are Czechoslovakian (37.0%, a difference of 0.010%), Celtic (37.0%, a difference of 0.050%), Korean (37.0%, a difference of 0.080%), Belgian (37.0%, a difference of 0.10%), and Immigrants from Costa Rica (36.9%, a difference of 0.21%).
| Demographics | Rating | Rank | Bachelor's Degree |
| Nigerians | 33.9 /100 | #191 | Fair 37.2% |
| Immigrants | Vietnam | 32.1 /100 | #192 | Fair 37.1% |
| Yugoslavians | 31.5 /100 | #193 | Fair 37.1% |
| Belgians | 29.9 /100 | #194 | Fair 37.0% |
| Koreans | 29.8 /100 | #195 | Fair 37.0% |
| Celtics | 29.5 /100 | #196 | Fair 37.0% |
| Czechoslovakians | 29.2 /100 | #197 | Fair 37.0% |
| Welsh | 29.1 /100 | #198 | Fair 37.0% |
| Immigrants | Costa Rica | 27.4 /100 | #199 | Fair 36.9% |
| Immigrants | Ghana | 27.4 /100 | #200 | Fair 36.9% |
| Immigrants | South Eastern Asia | 25.4 /100 | #201 | Fair 36.8% |
| Immigrants | Zaire | 25.3 /100 | #202 | Fair 36.8% |
| Immigrants | Nigeria | 23.1 /100 | #203 | Fair 36.7% |
| Immigrants | Immigrants | 22.8 /100 | #204 | Fair 36.7% |
| Finns | 22.2 /100 | #205 | Fair 36.7% |