Yugoslavian vs Immigrants from Jordan Bachelor's Degree
COMPARE
Yugoslavian
Immigrants from Jordan
Bachelor's Degree
Bachelor's Degree Comparison
Yugoslavians
Immigrants from Jordan
37.1%
BACHELOR'S DEGREE
31.5/ 100
METRIC RATING
193rd/ 347
METRIC RANK
40.3%
BACHELOR'S DEGREE
93.4/ 100
METRIC RATING
127th/ 347
METRIC RANK
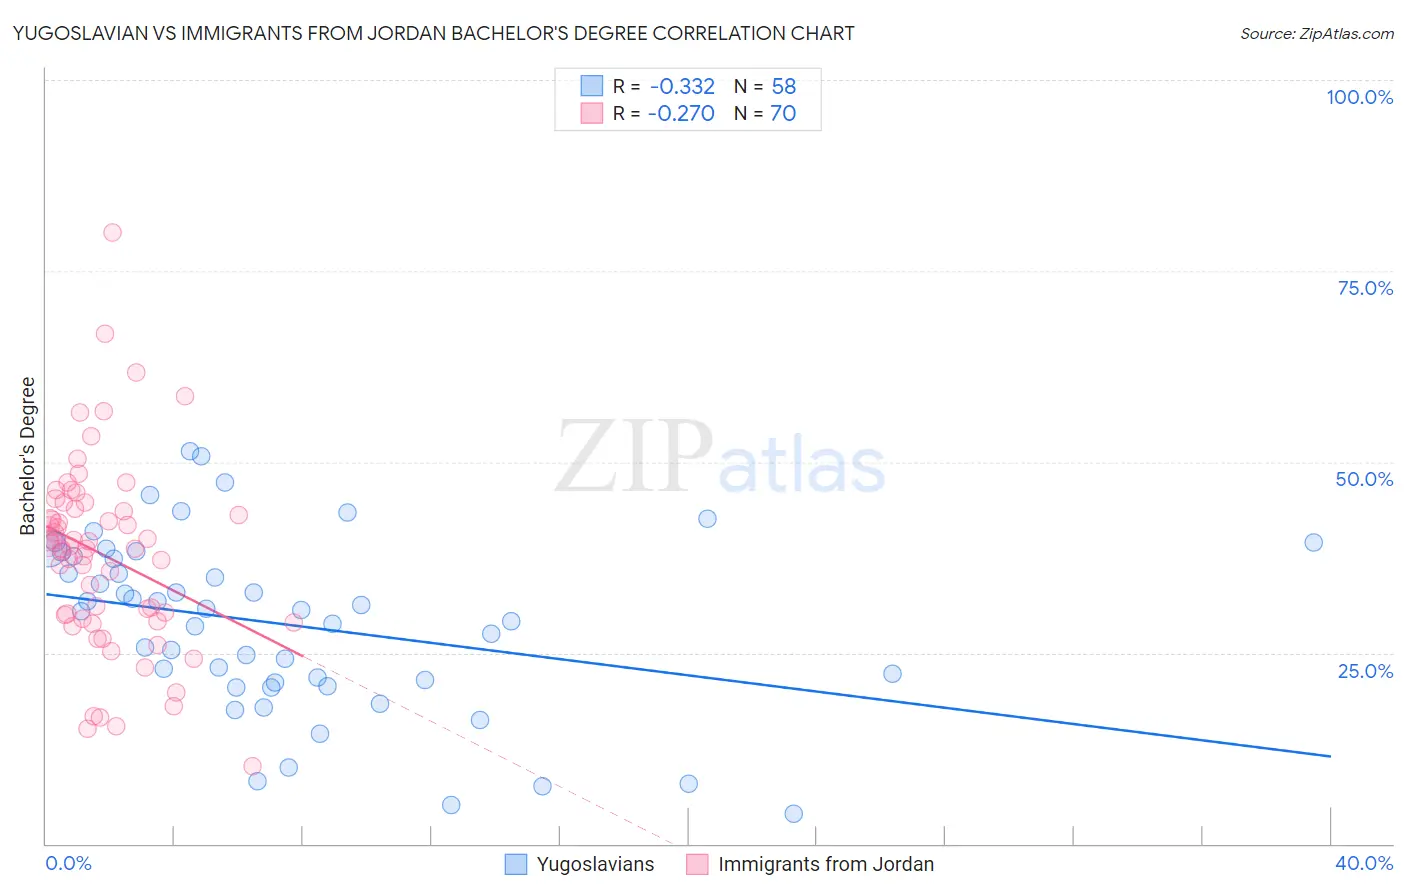
Yugoslavian vs Immigrants from Jordan Bachelor's Degree Correlation Chart
The statistical analysis conducted on geographies consisting of 285,712,263 people shows a mild negative correlation between the proportion of Yugoslavians and percentage of population with at least bachelor's degree education in the United States with a correlation coefficient (R) of -0.332 and weighted average of 37.1%. Similarly, the statistical analysis conducted on geographies consisting of 181,275,733 people shows a weak negative correlation between the proportion of Immigrants from Jordan and percentage of population with at least bachelor's degree education in the United States with a correlation coefficient (R) of -0.270 and weighted average of 40.3%, a difference of 8.5%.
Bachelor's Degree Correlation Summary
| Measurement | Yugoslavian | Immigrants from Jordan |
| Minimum | 3.9% | 10.2% |
| Maximum | 51.4% | 80.0% |
| Range | 47.5% | 69.8% |
| Mean | 28.7% | 37.8% |
| Median | 30.6% | 38.8% |
| Interquartile 25% (IQ1) | 21.2% | 29.5% |
| Interquartile 75% (IQ3) | 37.7% | 43.8% |
| Interquartile Range (IQR) | 16.5% | 14.3% |
| Standard Deviation (Sample) | 11.5% | 12.4% |
| Standard Deviation (Population) | 11.4% | 12.4% |
Similar Demographics by Bachelor's Degree
Demographics Similar to Yugoslavians by Bachelor's Degree
In terms of bachelor's degree, the demographic groups most similar to Yugoslavians are Immigrants from Vietnam (37.1%, a difference of 0.060%), Belgian (37.0%, a difference of 0.19%), Korean (37.0%, a difference of 0.20%), Celtic (37.0%, a difference of 0.23%), and Nigerian (37.2%, a difference of 0.27%).
| Demographics | Rating | Rank | Bachelor's Degree |
| Norwegians | 40.4 /100 | #186 | Average 37.5% |
| English | 39.7 /100 | #187 | Fair 37.4% |
| Immigrants | Oceania | 37.3 /100 | #188 | Fair 37.3% |
| Slovaks | 36.9 /100 | #189 | Fair 37.3% |
| Swiss | 34.1 /100 | #190 | Fair 37.2% |
| Nigerians | 33.9 /100 | #191 | Fair 37.2% |
| Immigrants | Vietnam | 32.1 /100 | #192 | Fair 37.1% |
| Yugoslavians | 31.5 /100 | #193 | Fair 37.1% |
| Belgians | 29.9 /100 | #194 | Fair 37.0% |
| Koreans | 29.8 /100 | #195 | Fair 37.0% |
| Celtics | 29.5 /100 | #196 | Fair 37.0% |
| Czechoslovakians | 29.2 /100 | #197 | Fair 37.0% |
| Welsh | 29.1 /100 | #198 | Fair 37.0% |
| Immigrants | Costa Rica | 27.4 /100 | #199 | Fair 36.9% |
| Immigrants | Ghana | 27.4 /100 | #200 | Fair 36.9% |
Demographics Similar to Immigrants from Jordan by Bachelor's Degree
In terms of bachelor's degree, the demographic groups most similar to Immigrants from Jordan are Immigrants from Venezuela (40.2%, a difference of 0.17%), Immigrants from Eastern Africa (40.4%, a difference of 0.28%), British (40.4%, a difference of 0.33%), Serbian (40.1%, a difference of 0.35%), and Immigrants from Eritrea (40.4%, a difference of 0.36%).
| Demographics | Rating | Rank | Bachelor's Degree |
| Venezuelans | 94.7 /100 | #120 | Exceptional 40.5% |
| Moroccans | 94.6 /100 | #121 | Exceptional 40.5% |
| Immigrants | Albania | 94.4 /100 | #122 | Exceptional 40.4% |
| Lebanese | 94.3 /100 | #123 | Exceptional 40.4% |
| Immigrants | Eritrea | 94.3 /100 | #124 | Exceptional 40.4% |
| British | 94.2 /100 | #125 | Exceptional 40.4% |
| Immigrants | Eastern Africa | 94.1 /100 | #126 | Exceptional 40.4% |
| Immigrants | Jordan | 93.4 /100 | #127 | Exceptional 40.3% |
| Immigrants | Venezuela | 92.9 /100 | #128 | Exceptional 40.2% |
| Serbians | 92.4 /100 | #129 | Exceptional 40.1% |
| Sierra Leoneans | 92.2 /100 | #130 | Exceptional 40.1% |
| Italians | 91.9 /100 | #131 | Exceptional 40.1% |
| Taiwanese | 91.1 /100 | #132 | Exceptional 40.0% |
| Immigrants | Southern Europe | 91.1 /100 | #133 | Exceptional 40.0% |
| Assyrians/Chaldeans/Syriacs | 89.4 /100 | #134 | Excellent 39.8% |