Basque vs Immigrants from Cuba Bachelor's Degree
COMPARE
Basque
Immigrants from Cuba
Bachelor's Degree
Bachelor's Degree Comparison
Basques
Immigrants from Cuba
37.7%
BACHELOR'S DEGREE
47.4/ 100
METRIC RATING
177th/ 347
METRIC RANK
30.3%
BACHELOR'S DEGREE
0.0/ 100
METRIC RATING
301st/ 347
METRIC RANK
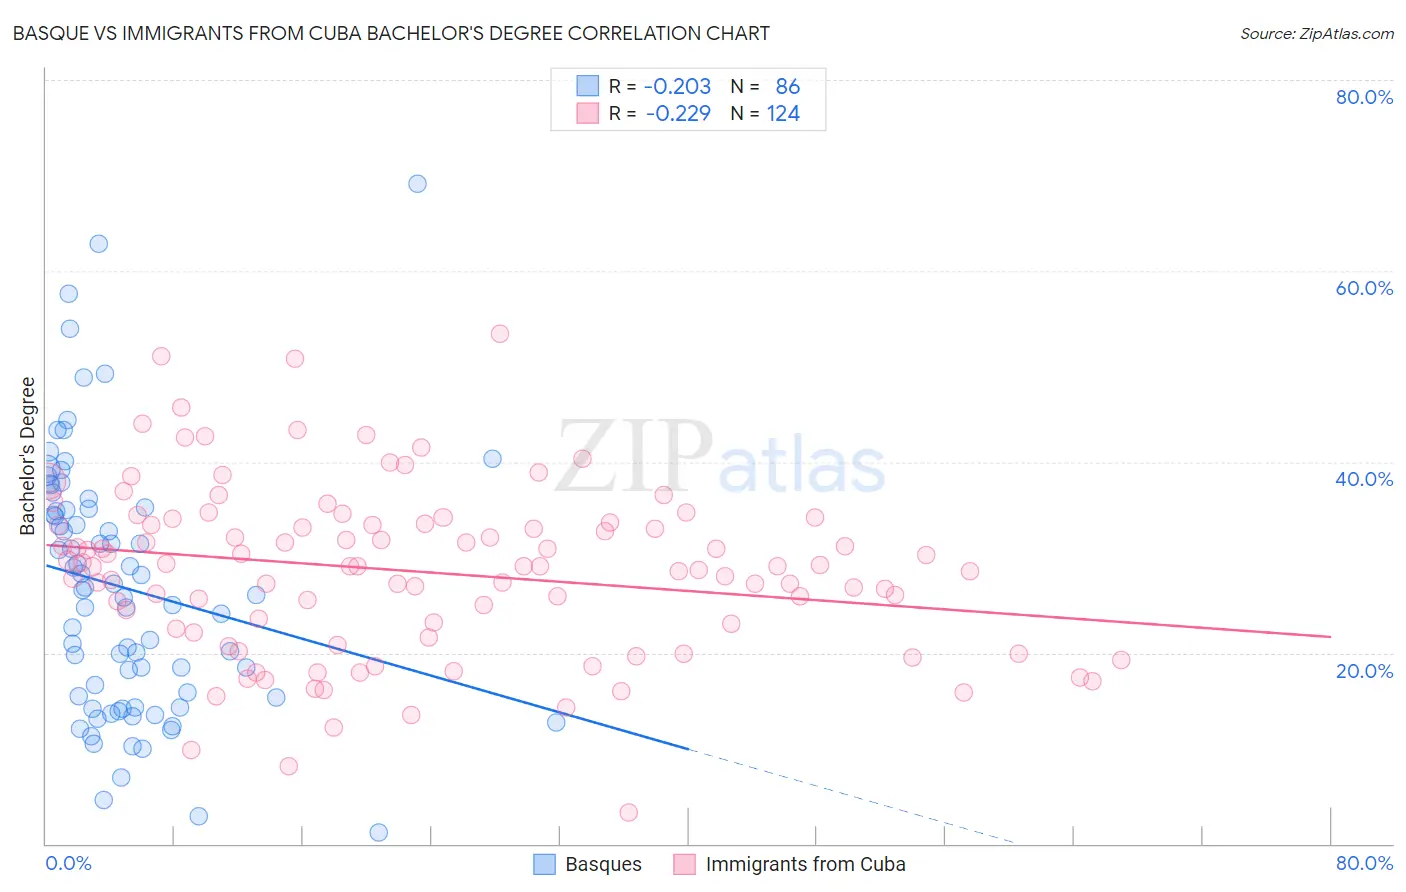
Basque vs Immigrants from Cuba Bachelor's Degree Correlation Chart
The statistical analysis conducted on geographies consisting of 165,778,138 people shows a weak negative correlation between the proportion of Basques and percentage of population with at least bachelor's degree education in the United States with a correlation coefficient (R) of -0.203 and weighted average of 37.7%. Similarly, the statistical analysis conducted on geographies consisting of 325,960,947 people shows a weak negative correlation between the proportion of Immigrants from Cuba and percentage of population with at least bachelor's degree education in the United States with a correlation coefficient (R) of -0.229 and weighted average of 30.3%, a difference of 24.4%.
Bachelor's Degree Correlation Summary
| Measurement | Basque | Immigrants from Cuba |
| Minimum | 1.2% | 3.3% |
| Maximum | 69.2% | 53.5% |
| Range | 68.0% | 50.2% |
| Mean | 26.8% | 28.5% |
| Median | 26.3% | 29.1% |
| Interquartile 25% (IQ1) | 15.4% | 22.3% |
| Interquartile 75% (IQ3) | 35.0% | 33.4% |
| Interquartile Range (IQR) | 19.7% | 11.1% |
| Standard Deviation (Sample) | 13.5% | 8.9% |
| Standard Deviation (Population) | 13.4% | 8.9% |
Similar Demographics by Bachelor's Degree
Demographics Similar to Basques by Bachelor's Degree
In terms of bachelor's degree, the demographic groups most similar to Basques are Costa Rican (37.7%, a difference of 0.020%), Immigrants from Cameroon (37.7%, a difference of 0.060%), Immigrants from Uruguay (37.8%, a difference of 0.090%), Immigrants from Colombia (37.7%, a difference of 0.19%), and Immigrants from Bangladesh (37.8%, a difference of 0.25%).
| Demographics | Rating | Rank | Bachelor's Degree |
| Czechs | 54.4 /100 | #170 | Average 38.0% |
| Bermudans | 54.2 /100 | #171 | Average 38.0% |
| Immigrants | Somalia | 52.8 /100 | #172 | Average 37.9% |
| Immigrants | Iraq | 52.5 /100 | #173 | Average 37.9% |
| Immigrants | Bangladesh | 50.0 /100 | #174 | Average 37.8% |
| Immigrants | Uruguay | 48.3 /100 | #175 | Average 37.8% |
| Costa Ricans | 47.6 /100 | #176 | Average 37.7% |
| Basques | 47.4 /100 | #177 | Average 37.7% |
| Immigrants | Cameroon | 46.8 /100 | #178 | Average 37.7% |
| Immigrants | Colombia | 45.4 /100 | #179 | Average 37.7% |
| Irish | 44.3 /100 | #180 | Average 37.6% |
| Immigrants | Senegal | 43.8 /100 | #181 | Average 37.6% |
| Immigrants | Bosnia and Herzegovina | 43.4 /100 | #182 | Average 37.6% |
| Senegalese | 42.2 /100 | #183 | Average 37.5% |
| Scandinavians | 41.7 /100 | #184 | Average 37.5% |
Demographics Similar to Immigrants from Cuba by Bachelor's Degree
In terms of bachelor's degree, the demographic groups most similar to Immigrants from Cuba are Immigrants from Micronesia (30.4%, a difference of 0.22%), Chickasaw (30.4%, a difference of 0.23%), Mexican American Indian (30.2%, a difference of 0.28%), Bangladeshi (30.2%, a difference of 0.45%), and Cherokee (30.2%, a difference of 0.45%).
| Demographics | Rating | Rank | Bachelor's Degree |
| Immigrants | Guatemala | 0.0 /100 | #294 | Tragic 30.8% |
| Immigrants | Dominican Republic | 0.0 /100 | #295 | Tragic 30.7% |
| Puget Sound Salish | 0.0 /100 | #296 | Tragic 30.7% |
| Immigrants | Haiti | 0.0 /100 | #297 | Tragic 30.6% |
| Chippewa | 0.0 /100 | #298 | Tragic 30.6% |
| Chickasaw | 0.0 /100 | #299 | Tragic 30.4% |
| Immigrants | Micronesia | 0.0 /100 | #300 | Tragic 30.4% |
| Immigrants | Cuba | 0.0 /100 | #301 | Tragic 30.3% |
| Mexican American Indians | 0.0 /100 | #302 | Tragic 30.2% |
| Bangladeshis | 0.0 /100 | #303 | Tragic 30.2% |
| Cherokee | 0.0 /100 | #304 | Tragic 30.2% |
| Immigrants | Latin America | 0.0 /100 | #305 | Tragic 30.1% |
| Immigrants | Yemen | 0.0 /100 | #306 | Tragic 29.9% |
| Nepalese | 0.0 /100 | #307 | Tragic 29.9% |
| Cajuns | 0.0 /100 | #308 | Tragic 29.6% |