Basque vs Immigrants from Lithuania Bachelor's Degree
COMPARE
Basque
Immigrants from Lithuania
Bachelor's Degree
Bachelor's Degree Comparison
Basques
Immigrants from Lithuania
37.7%
BACHELOR'S DEGREE
47.4/ 100
METRIC RATING
177th/ 347
METRIC RANK
44.6%
BACHELOR'S DEGREE
99.9/ 100
METRIC RATING
44th/ 347
METRIC RANK
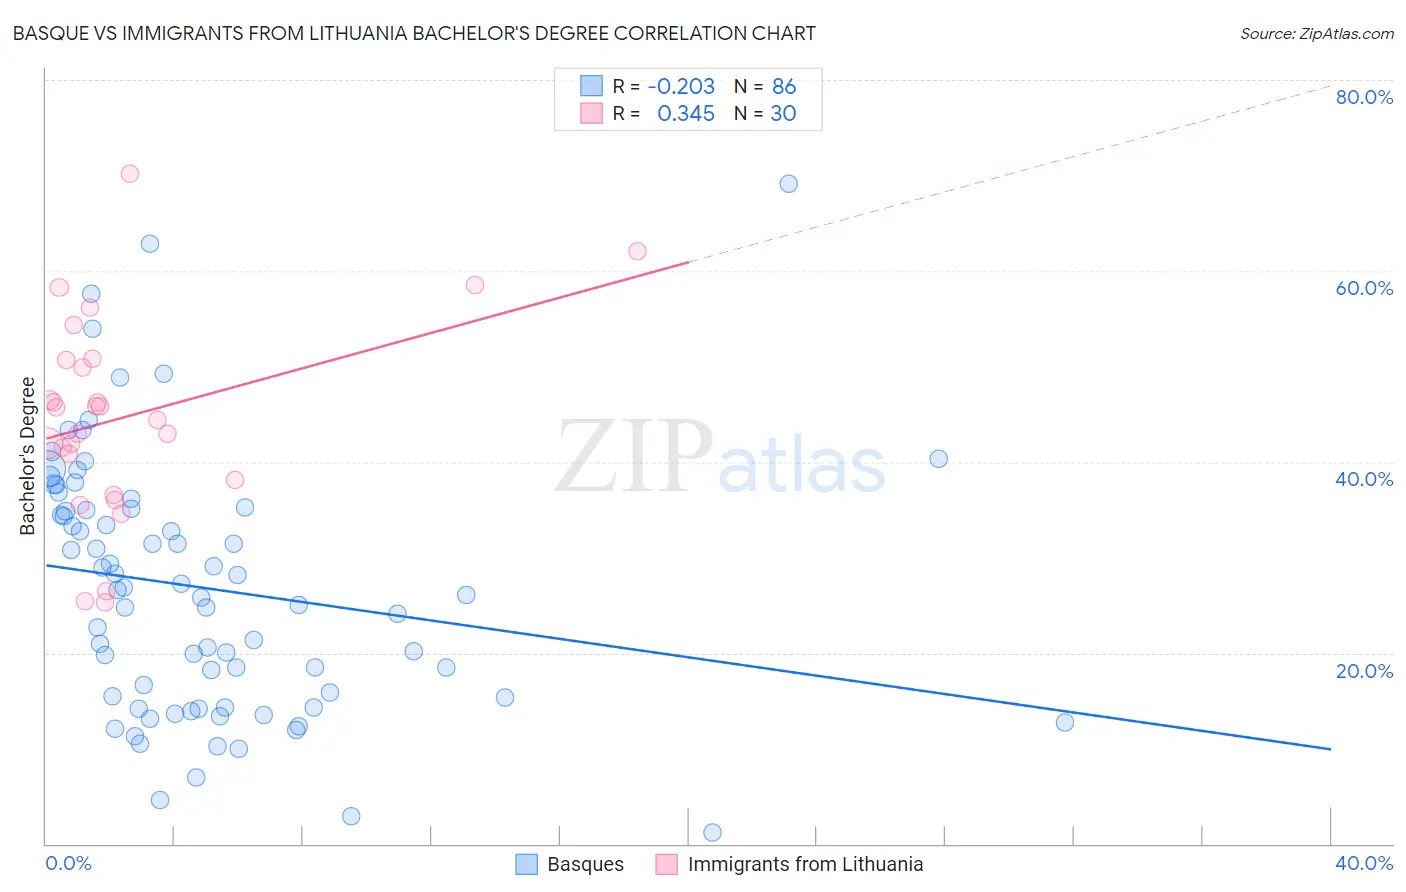
Basque vs Immigrants from Lithuania Bachelor's Degree Correlation Chart
The statistical analysis conducted on geographies consisting of 165,778,138 people shows a weak negative correlation between the proportion of Basques and percentage of population with at least bachelor's degree education in the United States with a correlation coefficient (R) of -0.203 and weighted average of 37.7%. Similarly, the statistical analysis conducted on geographies consisting of 117,722,731 people shows a mild positive correlation between the proportion of Immigrants from Lithuania and percentage of population with at least bachelor's degree education in the United States with a correlation coefficient (R) of 0.345 and weighted average of 44.6%, a difference of 18.3%.
Bachelor's Degree Correlation Summary
| Measurement | Basque | Immigrants from Lithuania |
| Minimum | 1.2% | 25.2% |
| Maximum | 69.2% | 70.2% |
| Range | 68.0% | 45.0% |
| Mean | 26.8% | 44.7% |
| Median | 26.3% | 45.0% |
| Interquartile 25% (IQ1) | 15.4% | 38.1% |
| Interquartile 75% (IQ3) | 35.0% | 50.7% |
| Interquartile Range (IQR) | 19.7% | 12.6% |
| Standard Deviation (Sample) | 13.5% | 10.5% |
| Standard Deviation (Population) | 13.4% | 10.3% |
Similar Demographics by Bachelor's Degree
Demographics Similar to Basques by Bachelor's Degree
In terms of bachelor's degree, the demographic groups most similar to Basques are Costa Rican (37.7%, a difference of 0.020%), Immigrants from Cameroon (37.7%, a difference of 0.060%), Immigrants from Uruguay (37.8%, a difference of 0.090%), Immigrants from Colombia (37.7%, a difference of 0.19%), and Immigrants from Bangladesh (37.8%, a difference of 0.25%).
| Demographics | Rating | Rank | Bachelor's Degree |
| Czechs | 54.4 /100 | #170 | Average 38.0% |
| Bermudans | 54.2 /100 | #171 | Average 38.0% |
| Immigrants | Somalia | 52.8 /100 | #172 | Average 37.9% |
| Immigrants | Iraq | 52.5 /100 | #173 | Average 37.9% |
| Immigrants | Bangladesh | 50.0 /100 | #174 | Average 37.8% |
| Immigrants | Uruguay | 48.3 /100 | #175 | Average 37.8% |
| Costa Ricans | 47.6 /100 | #176 | Average 37.7% |
| Basques | 47.4 /100 | #177 | Average 37.7% |
| Immigrants | Cameroon | 46.8 /100 | #178 | Average 37.7% |
| Immigrants | Colombia | 45.4 /100 | #179 | Average 37.7% |
| Irish | 44.3 /100 | #180 | Average 37.6% |
| Immigrants | Senegal | 43.8 /100 | #181 | Average 37.6% |
| Immigrants | Bosnia and Herzegovina | 43.4 /100 | #182 | Average 37.6% |
| Senegalese | 42.2 /100 | #183 | Average 37.5% |
| Scandinavians | 41.7 /100 | #184 | Average 37.5% |
Demographics Similar to Immigrants from Lithuania by Bachelor's Degree
In terms of bachelor's degree, the demographic groups most similar to Immigrants from Lithuania are Immigrants from Kuwait (44.6%, a difference of 0.030%), Immigrants from Bulgaria (44.6%, a difference of 0.080%), Bolivian (44.6%, a difference of 0.12%), Estonian (44.6%, a difference of 0.12%), and Immigrants from Norway (44.5%, a difference of 0.25%).
| Demographics | Rating | Rank | Bachelor's Degree |
| Russians | 100.0 /100 | #37 | Exceptional 45.3% |
| Bulgarians | 100.0 /100 | #38 | Exceptional 45.3% |
| Immigrants | Latvia | 100.0 /100 | #39 | Exceptional 45.1% |
| Immigrants | Belarus | 100.0 /100 | #40 | Exceptional 45.0% |
| Immigrants | Malaysia | 100.0 /100 | #41 | Exceptional 45.0% |
| Immigrants | Saudi Arabia | 100.0 /100 | #42 | Exceptional 44.8% |
| Immigrants | South Africa | 99.9 /100 | #43 | Exceptional 44.8% |
| Immigrants | Lithuania | 99.9 /100 | #44 | Exceptional 44.6% |
| Immigrants | Kuwait | 99.9 /100 | #45 | Exceptional 44.6% |
| Immigrants | Bulgaria | 99.9 /100 | #46 | Exceptional 44.6% |
| Bolivians | 99.9 /100 | #47 | Exceptional 44.6% |
| Estonians | 99.9 /100 | #48 | Exceptional 44.6% |
| Immigrants | Norway | 99.9 /100 | #49 | Exceptional 44.5% |
| Immigrants | Greece | 99.9 /100 | #50 | Exceptional 44.5% |
| Asians | 99.9 /100 | #51 | Exceptional 44.4% |