Basque vs Immigrants from Jordan High School Diploma
COMPARE
Basque
Immigrants from Jordan
High School Diploma
High School Diploma Comparison
Basques
Immigrants from Jordan
89.8%
HIGH SCHOOL DIPLOMA
88.5/ 100
METRIC RATING
129th/ 347
METRIC RANK
89.8%
HIGH SCHOOL DIPLOMA
87.2/ 100
METRIC RATING
134th/ 347
METRIC RANK
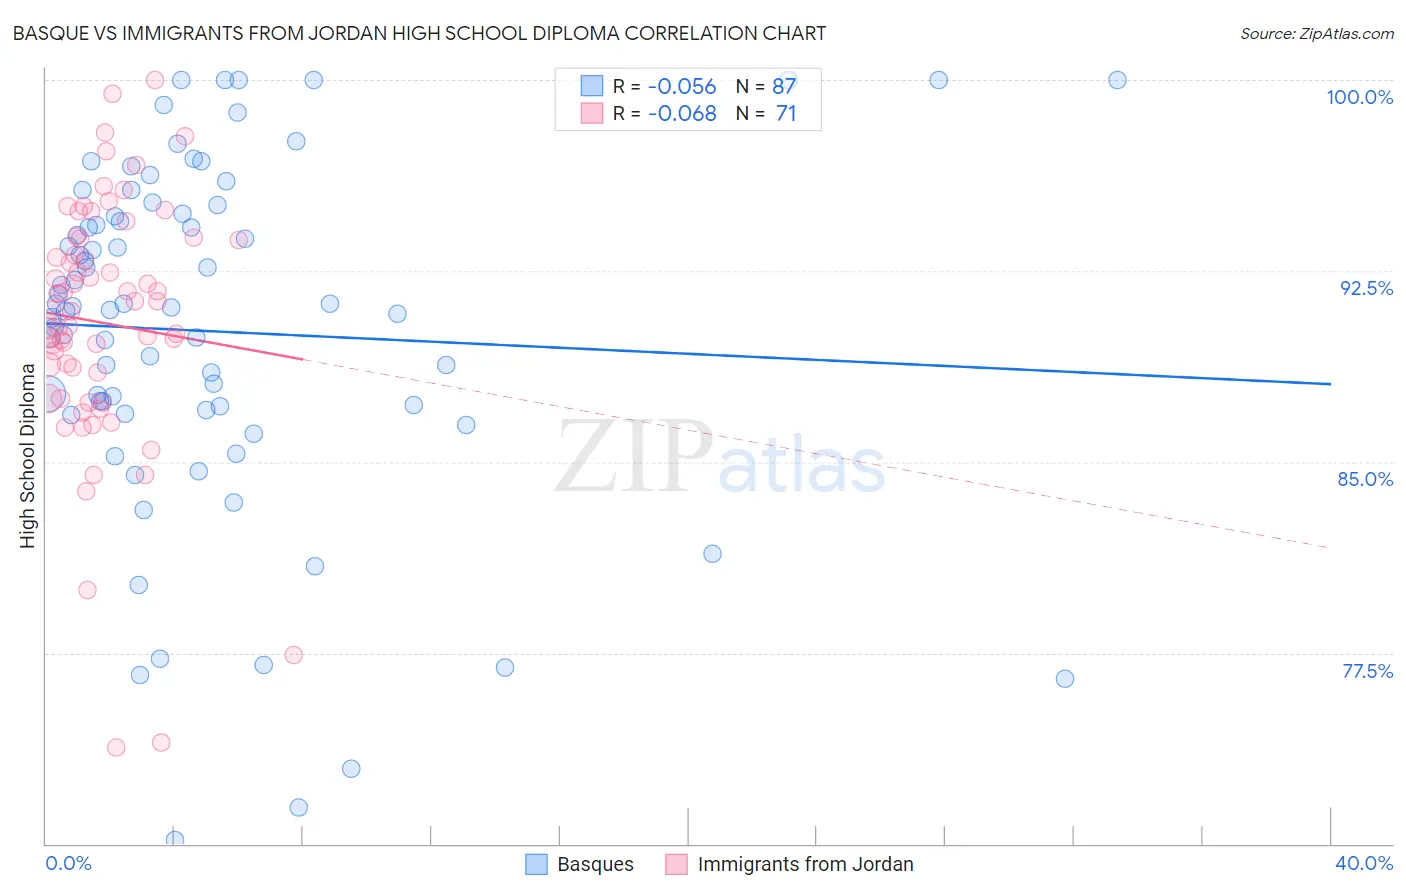
Basque vs Immigrants from Jordan High School Diploma Correlation Chart
The statistical analysis conducted on geographies consisting of 165,778,674 people shows a slight negative correlation between the proportion of Basques and percentage of population with at least high school diploma education in the United States with a correlation coefficient (R) of -0.056 and weighted average of 89.8%. Similarly, the statistical analysis conducted on geographies consisting of 181,278,272 people shows a slight negative correlation between the proportion of Immigrants from Jordan and percentage of population with at least high school diploma education in the United States with a correlation coefficient (R) of -0.068 and weighted average of 89.8%, a difference of 0.050%.
High School Diploma Correlation Summary
| Measurement | Basque | Immigrants from Jordan |
| Minimum | 70.1% | 73.8% |
| Maximum | 100.0% | 100.0% |
| Range | 29.9% | 26.2% |
| Mean | 90.1% | 90.5% |
| Median | 91.1% | 91.0% |
| Interquartile 25% (IQ1) | 87.0% | 87.5% |
| Interquartile 75% (IQ3) | 94.7% | 93.8% |
| Interquartile Range (IQR) | 7.7% | 6.3% |
| Standard Deviation (Sample) | 6.8% | 5.0% |
| Standard Deviation (Population) | 6.8% | 5.0% |
Demographics Similar to Basques and Immigrants from Jordan by High School Diploma
In terms of high school diploma, the demographic groups most similar to Basques are Puget Sound Salish (89.9%, a difference of 0.020%), Immigrants from Ukraine (89.8%, a difference of 0.020%), Immigrants from Eastern Asia (89.9%, a difference of 0.030%), Immigrants from Italy (89.8%, a difference of 0.040%), and Immigrants from Bosnia and Herzegovina (89.8%, a difference of 0.040%). Similarly, the demographic groups most similar to Immigrants from Jordan are Immigrants from Bosnia and Herzegovina (89.8%, a difference of 0.0%), Albanian (89.8%, a difference of 0.0%), Immigrants from Italy (89.8%, a difference of 0.010%), Immigrants from Ukraine (89.8%, a difference of 0.020%), and Chippewa (89.7%, a difference of 0.050%).
| Demographics | Rating | Rank | High School Diploma |
| Whites/Caucasians | 94.1 /100 | #121 | Exceptional 90.1% |
| Immigrants | Kazakhstan | 93.4 /100 | #122 | Exceptional 90.0% |
| German Russians | 92.0 /100 | #123 | Exceptional 90.0% |
| Mongolians | 91.6 /100 | #124 | Exceptional 89.9% |
| Egyptians | 91.1 /100 | #125 | Exceptional 89.9% |
| Alaska Natives | 91.0 /100 | #126 | Exceptional 89.9% |
| Immigrants | Eastern Asia | 89.2 /100 | #127 | Excellent 89.9% |
| Puget Sound Salish | 89.1 /100 | #128 | Excellent 89.9% |
| Basques | 88.5 /100 | #129 | Excellent 89.8% |
| Immigrants | Ukraine | 87.9 /100 | #130 | Excellent 89.8% |
| Immigrants | Italy | 87.4 /100 | #131 | Excellent 89.8% |
| Immigrants | Bosnia and Herzegovina | 87.3 /100 | #132 | Excellent 89.8% |
| Albanians | 87.2 /100 | #133 | Excellent 89.8% |
| Immigrants | Jordan | 87.2 /100 | #134 | Excellent 89.8% |
| Chippewa | 85.6 /100 | #135 | Excellent 89.7% |
| Ugandans | 83.7 /100 | #136 | Excellent 89.7% |
| Arabs | 83.6 /100 | #137 | Excellent 89.7% |
| Assyrians/Chaldeans/Syriacs | 82.5 /100 | #138 | Excellent 89.7% |
| Kenyans | 81.4 /100 | #139 | Excellent 89.6% |
| Immigrants | Egypt | 81.2 /100 | #140 | Excellent 89.6% |
| Chileans | 79.0 /100 | #141 | Good 89.6% |