Basque vs Immigrants from Eastern Europe Bachelor's Degree
COMPARE
Basque
Immigrants from Eastern Europe
Bachelor's Degree
Bachelor's Degree Comparison
Basques
Immigrants from Eastern Europe
37.7%
BACHELOR'S DEGREE
47.4/ 100
METRIC RATING
177th/ 347
METRIC RANK
42.5%
BACHELOR'S DEGREE
99.4/ 100
METRIC RATING
77th/ 347
METRIC RANK
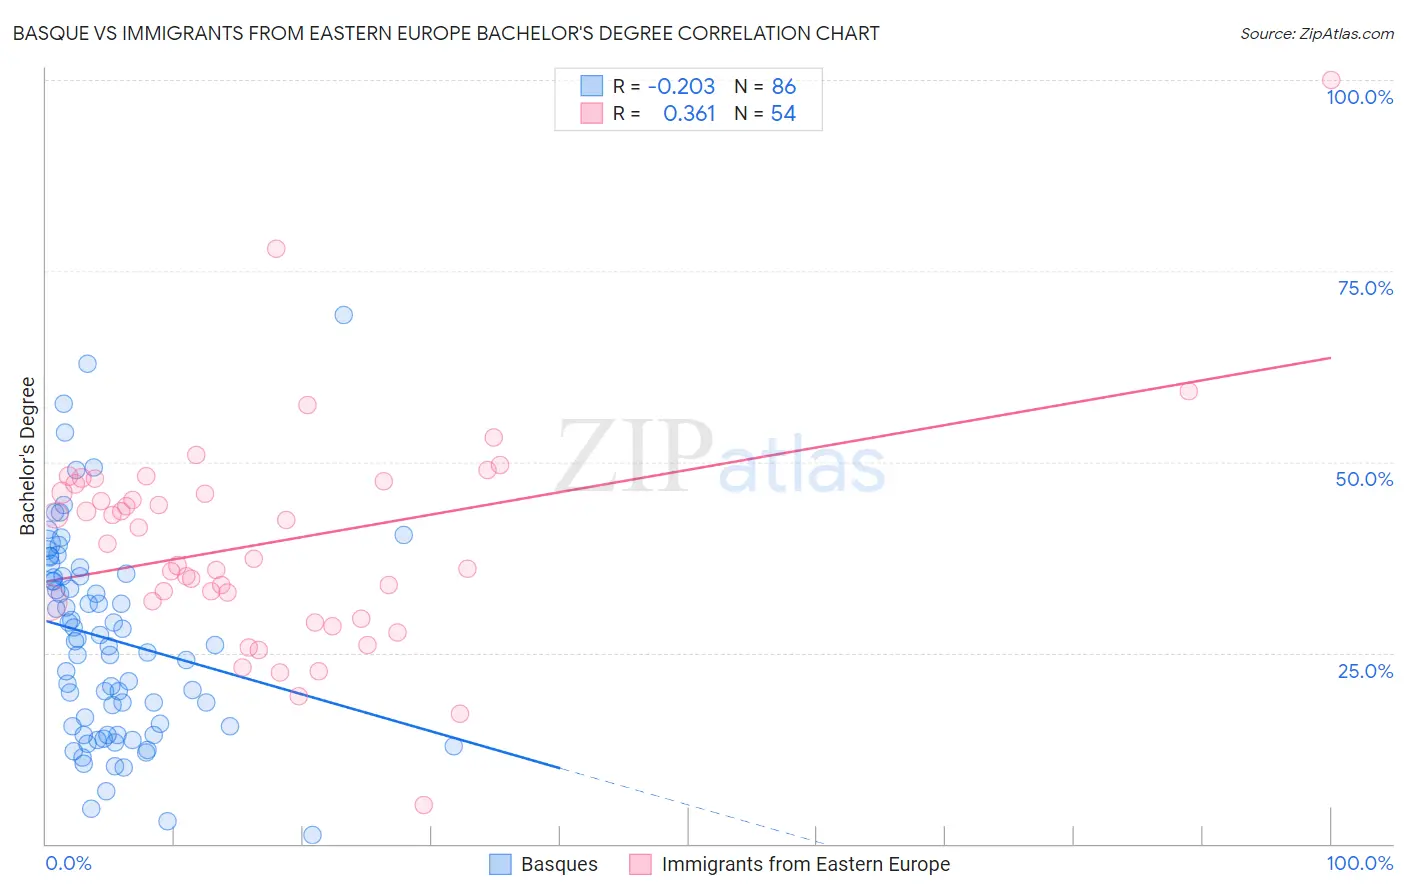
Basque vs Immigrants from Eastern Europe Bachelor's Degree Correlation Chart
The statistical analysis conducted on geographies consisting of 165,778,138 people shows a weak negative correlation between the proportion of Basques and percentage of population with at least bachelor's degree education in the United States with a correlation coefficient (R) of -0.203 and weighted average of 37.7%. Similarly, the statistical analysis conducted on geographies consisting of 475,819,217 people shows a mild positive correlation between the proportion of Immigrants from Eastern Europe and percentage of population with at least bachelor's degree education in the United States with a correlation coefficient (R) of 0.361 and weighted average of 42.5%, a difference of 12.6%.
Bachelor's Degree Correlation Summary
| Measurement | Basque | Immigrants from Eastern Europe |
| Minimum | 1.2% | 5.0% |
| Maximum | 69.2% | 100.0% |
| Range | 68.0% | 95.0% |
| Mean | 26.8% | 39.5% |
| Median | 26.3% | 38.3% |
| Interquartile 25% (IQ1) | 15.4% | 31.6% |
| Interquartile 75% (IQ3) | 35.0% | 47.1% |
| Interquartile Range (IQR) | 19.7% | 15.5% |
| Standard Deviation (Sample) | 13.5% | 14.7% |
| Standard Deviation (Population) | 13.4% | 14.5% |
Similar Demographics by Bachelor's Degree
Demographics Similar to Basques by Bachelor's Degree
In terms of bachelor's degree, the demographic groups most similar to Basques are Costa Rican (37.7%, a difference of 0.020%), Immigrants from Cameroon (37.7%, a difference of 0.060%), Immigrants from Uruguay (37.8%, a difference of 0.090%), Immigrants from Colombia (37.7%, a difference of 0.19%), and Immigrants from Bangladesh (37.8%, a difference of 0.25%).
| Demographics | Rating | Rank | Bachelor's Degree |
| Czechs | 54.4 /100 | #170 | Average 38.0% |
| Bermudans | 54.2 /100 | #171 | Average 38.0% |
| Immigrants | Somalia | 52.8 /100 | #172 | Average 37.9% |
| Immigrants | Iraq | 52.5 /100 | #173 | Average 37.9% |
| Immigrants | Bangladesh | 50.0 /100 | #174 | Average 37.8% |
| Immigrants | Uruguay | 48.3 /100 | #175 | Average 37.8% |
| Costa Ricans | 47.6 /100 | #176 | Average 37.7% |
| Basques | 47.4 /100 | #177 | Average 37.7% |
| Immigrants | Cameroon | 46.8 /100 | #178 | Average 37.7% |
| Immigrants | Colombia | 45.4 /100 | #179 | Average 37.7% |
| Irish | 44.3 /100 | #180 | Average 37.6% |
| Immigrants | Senegal | 43.8 /100 | #181 | Average 37.6% |
| Immigrants | Bosnia and Herzegovina | 43.4 /100 | #182 | Average 37.6% |
| Senegalese | 42.2 /100 | #183 | Average 37.5% |
| Scandinavians | 41.7 /100 | #184 | Average 37.5% |
Demographics Similar to Immigrants from Eastern Europe by Bachelor's Degree
In terms of bachelor's degree, the demographic groups most similar to Immigrants from Eastern Europe are Immigrants from Ethiopia (42.5%, a difference of 0.060%), Immigrants from Egypt (42.6%, a difference of 0.18%), Immigrants from Zimbabwe (42.6%, a difference of 0.20%), Immigrants from Lebanon (42.4%, a difference of 0.23%), and Bhutanese (42.7%, a difference of 0.41%).
| Demographics | Rating | Rank | Bachelor's Degree |
| Immigrants | Romania | 99.6 /100 | #70 | Exceptional 42.9% |
| Immigrants | Argentina | 99.6 /100 | #71 | Exceptional 42.8% |
| Ethiopians | 99.5 /100 | #72 | Exceptional 42.8% |
| Immigrants | Uzbekistan | 99.5 /100 | #73 | Exceptional 42.8% |
| Bhutanese | 99.5 /100 | #74 | Exceptional 42.7% |
| Immigrants | Zimbabwe | 99.4 /100 | #75 | Exceptional 42.6% |
| Immigrants | Egypt | 99.4 /100 | #76 | Exceptional 42.6% |
| Immigrants | Eastern Europe | 99.4 /100 | #77 | Exceptional 42.5% |
| Immigrants | Ethiopia | 99.4 /100 | #78 | Exceptional 42.5% |
| Immigrants | Lebanon | 99.3 /100 | #79 | Exceptional 42.4% |
| Immigrants | Croatia | 99.2 /100 | #80 | Exceptional 42.3% |
| Immigrants | Hungary | 99.2 /100 | #81 | Exceptional 42.3% |
| Immigrants | Scotland | 99.2 /100 | #82 | Exceptional 42.3% |
| Armenians | 99.2 /100 | #83 | Exceptional 42.3% |
| Immigrants | Western Asia | 99.2 /100 | #84 | Exceptional 42.3% |