Spaniard vs Immigrants from Jordan Bachelor's Degree
COMPARE
Spaniard
Immigrants from Jordan
Bachelor's Degree
Bachelor's Degree Comparison
Spaniards
Immigrants from Jordan
36.6%
BACHELOR'S DEGREE
21.2/ 100
METRIC RATING
206th/ 347
METRIC RANK
40.3%
BACHELOR'S DEGREE
93.4/ 100
METRIC RATING
127th/ 347
METRIC RANK
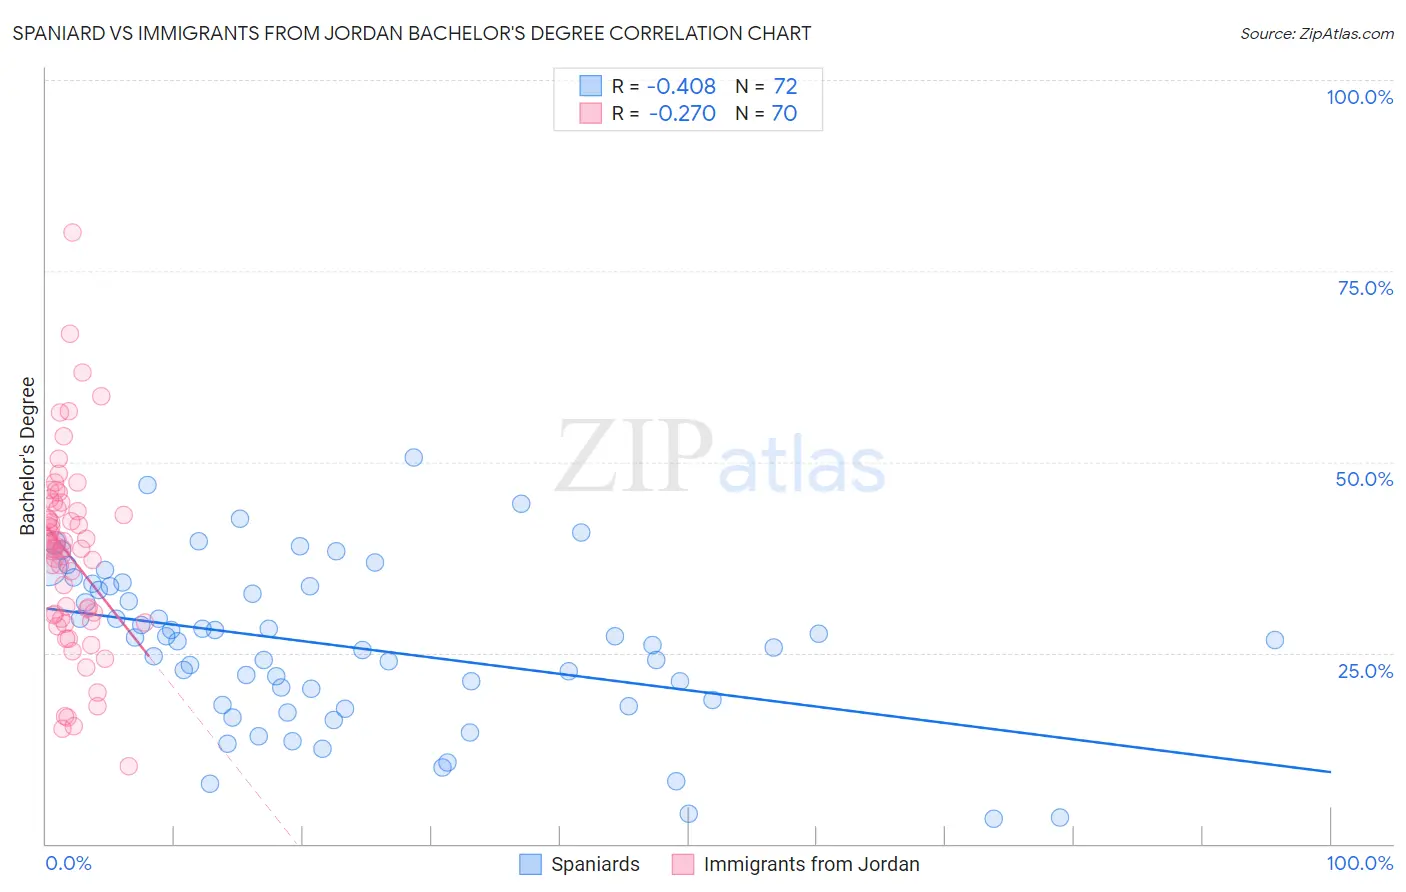
Spaniard vs Immigrants from Jordan Bachelor's Degree Correlation Chart
The statistical analysis conducted on geographies consisting of 443,489,635 people shows a moderate negative correlation between the proportion of Spaniards and percentage of population with at least bachelor's degree education in the United States with a correlation coefficient (R) of -0.408 and weighted average of 36.6%. Similarly, the statistical analysis conducted on geographies consisting of 181,275,733 people shows a weak negative correlation between the proportion of Immigrants from Jordan and percentage of population with at least bachelor's degree education in the United States with a correlation coefficient (R) of -0.270 and weighted average of 40.3%, a difference of 10.0%.
Bachelor's Degree Correlation Summary
| Measurement | Spaniard | Immigrants from Jordan |
| Minimum | 3.3% | 10.2% |
| Maximum | 50.5% | 80.0% |
| Range | 47.2% | 69.8% |
| Mean | 25.9% | 37.8% |
| Median | 26.6% | 38.8% |
| Interquartile 25% (IQ1) | 18.4% | 29.5% |
| Interquartile 75% (IQ3) | 33.7% | 43.8% |
| Interquartile Range (IQR) | 15.3% | 14.3% |
| Standard Deviation (Sample) | 10.5% | 12.4% |
| Standard Deviation (Population) | 10.4% | 12.4% |
Similar Demographics by Bachelor's Degree
Demographics Similar to Spaniards by Bachelor's Degree
In terms of bachelor's degree, the demographic groups most similar to Spaniards are Immigrants from Middle Africa (36.6%, a difference of 0.090%), Finnish (36.7%, a difference of 0.14%), Immigrants (36.7%, a difference of 0.24%), Immigrants from Nigeria (36.7%, a difference of 0.28%), and Immigrants from Thailand (36.5%, a difference of 0.28%).
| Demographics | Rating | Rank | Bachelor's Degree |
| Immigrants | Costa Rica | 27.4 /100 | #199 | Fair 36.9% |
| Immigrants | Ghana | 27.4 /100 | #200 | Fair 36.9% |
| Immigrants | South Eastern Asia | 25.4 /100 | #201 | Fair 36.8% |
| Immigrants | Zaire | 25.3 /100 | #202 | Fair 36.8% |
| Immigrants | Nigeria | 23.1 /100 | #203 | Fair 36.7% |
| Immigrants | Immigrants | 22.8 /100 | #204 | Fair 36.7% |
| Finns | 22.2 /100 | #205 | Fair 36.7% |
| Spaniards | 21.2 /100 | #206 | Fair 36.6% |
| Immigrants | Middle Africa | 20.6 /100 | #207 | Fair 36.6% |
| Immigrants | Thailand | 19.4 /100 | #208 | Poor 36.5% |
| Panamanians | 18.8 /100 | #209 | Poor 36.5% |
| French | 18.6 /100 | #210 | Poor 36.5% |
| Scotch-Irish | 18.3 /100 | #211 | Poor 36.4% |
| Immigrants | Philippines | 17.8 /100 | #212 | Poor 36.4% |
| Immigrants | Panama | 14.2 /100 | #213 | Poor 36.2% |
Demographics Similar to Immigrants from Jordan by Bachelor's Degree
In terms of bachelor's degree, the demographic groups most similar to Immigrants from Jordan are Immigrants from Venezuela (40.2%, a difference of 0.17%), Immigrants from Eastern Africa (40.4%, a difference of 0.28%), British (40.4%, a difference of 0.33%), Serbian (40.1%, a difference of 0.35%), and Immigrants from Eritrea (40.4%, a difference of 0.36%).
| Demographics | Rating | Rank | Bachelor's Degree |
| Venezuelans | 94.7 /100 | #120 | Exceptional 40.5% |
| Moroccans | 94.6 /100 | #121 | Exceptional 40.5% |
| Immigrants | Albania | 94.4 /100 | #122 | Exceptional 40.4% |
| Lebanese | 94.3 /100 | #123 | Exceptional 40.4% |
| Immigrants | Eritrea | 94.3 /100 | #124 | Exceptional 40.4% |
| British | 94.2 /100 | #125 | Exceptional 40.4% |
| Immigrants | Eastern Africa | 94.1 /100 | #126 | Exceptional 40.4% |
| Immigrants | Jordan | 93.4 /100 | #127 | Exceptional 40.3% |
| Immigrants | Venezuela | 92.9 /100 | #128 | Exceptional 40.2% |
| Serbians | 92.4 /100 | #129 | Exceptional 40.1% |
| Sierra Leoneans | 92.2 /100 | #130 | Exceptional 40.1% |
| Italians | 91.9 /100 | #131 | Exceptional 40.1% |
| Taiwanese | 91.1 /100 | #132 | Exceptional 40.0% |
| Immigrants | Southern Europe | 91.1 /100 | #133 | Exceptional 40.0% |
| Assyrians/Chaldeans/Syriacs | 89.4 /100 | #134 | Excellent 39.8% |