West Indian vs Immigrants from Jordan Bachelor's Degree
COMPARE
West Indian
Immigrants from Jordan
Bachelor's Degree
Bachelor's Degree Comparison
West Indians
Immigrants from Jordan
35.8%
BACHELOR'S DEGREE
9.7/ 100
METRIC RATING
219th/ 347
METRIC RANK
40.3%
BACHELOR'S DEGREE
93.4/ 100
METRIC RATING
127th/ 347
METRIC RANK
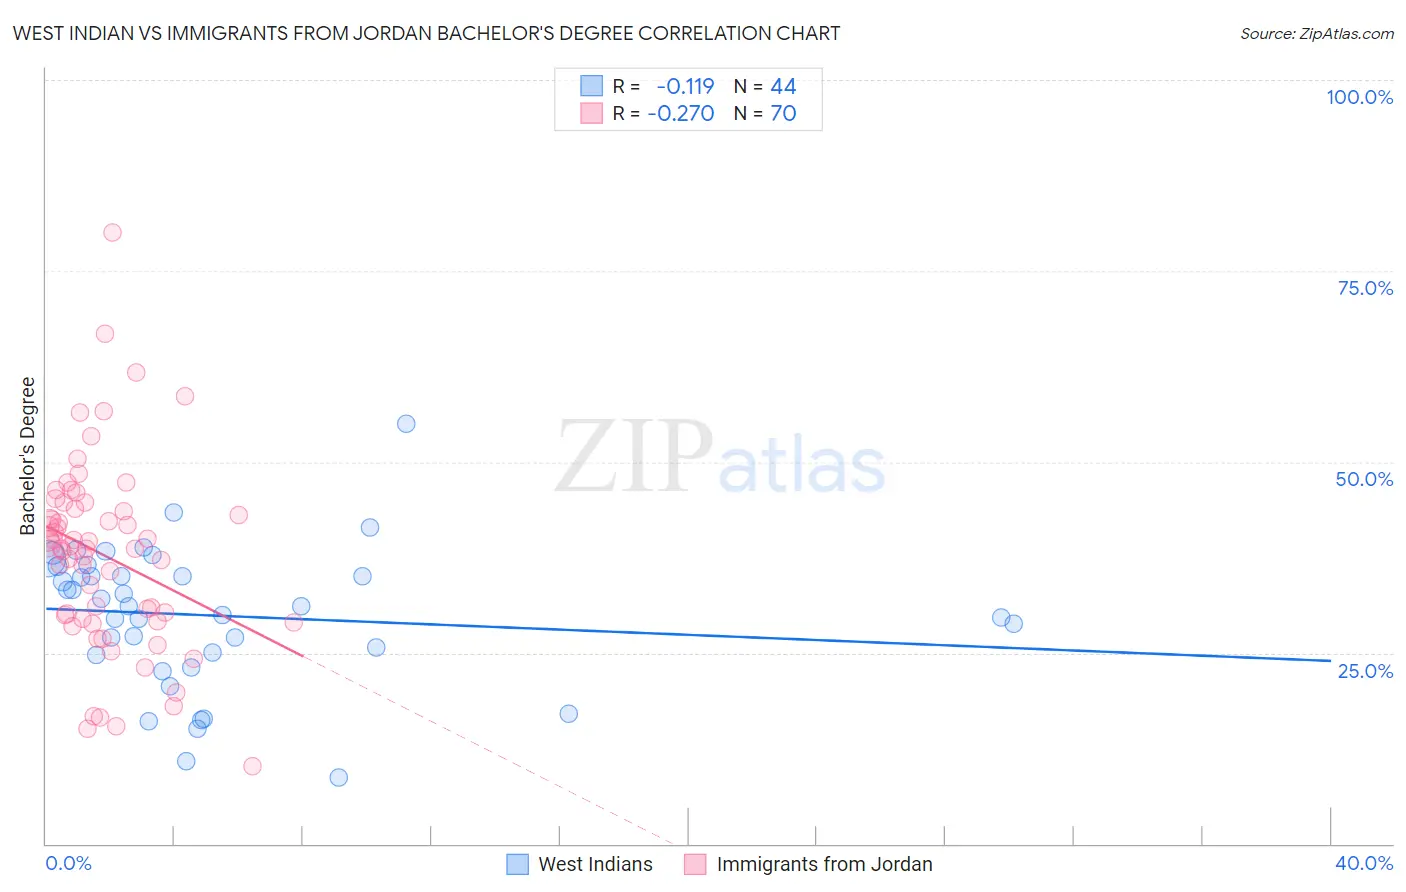
West Indian vs Immigrants from Jordan Bachelor's Degree Correlation Chart
The statistical analysis conducted on geographies consisting of 254,052,702 people shows a poor negative correlation between the proportion of West Indians and percentage of population with at least bachelor's degree education in the United States with a correlation coefficient (R) of -0.119 and weighted average of 35.8%. Similarly, the statistical analysis conducted on geographies consisting of 181,275,733 people shows a weak negative correlation between the proportion of Immigrants from Jordan and percentage of population with at least bachelor's degree education in the United States with a correlation coefficient (R) of -0.270 and weighted average of 40.3%, a difference of 12.5%.
Bachelor's Degree Correlation Summary
| Measurement | West Indian | Immigrants from Jordan |
| Minimum | 8.6% | 10.2% |
| Maximum | 54.9% | 80.0% |
| Range | 46.3% | 69.8% |
| Mean | 29.9% | 37.8% |
| Median | 31.1% | 38.8% |
| Interquartile 25% (IQ1) | 24.9% | 29.5% |
| Interquartile 75% (IQ3) | 35.7% | 43.8% |
| Interquartile Range (IQR) | 10.9% | 14.3% |
| Standard Deviation (Sample) | 9.2% | 12.4% |
| Standard Deviation (Population) | 9.1% | 12.4% |
Similar Demographics by Bachelor's Degree
Demographics Similar to West Indians by Bachelor's Degree
In terms of bachelor's degree, the demographic groups most similar to West Indians are Subsaharan African (35.8%, a difference of 0.030%), Spanish (35.8%, a difference of 0.040%), German Russian (35.8%, a difference of 0.13%), Dutch (35.7%, a difference of 0.15%), and Trinidadian and Tobagonian (35.7%, a difference of 0.29%).
| Demographics | Rating | Rank | Bachelor's Degree |
| Immigrants | Philippines | 17.8 /100 | #212 | Poor 36.4% |
| Immigrants | Panama | 14.2 /100 | #213 | Poor 36.2% |
| Germans | 13.9 /100 | #214 | Poor 36.1% |
| Immigrants | Western Africa | 13.8 /100 | #215 | Poor 36.1% |
| Barbadians | 13.5 /100 | #216 | Poor 36.1% |
| German Russians | 10.2 /100 | #217 | Poor 35.8% |
| Sub-Saharan Africans | 9.8 /100 | #218 | Tragic 35.8% |
| West Indians | 9.7 /100 | #219 | Tragic 35.8% |
| Spanish | 9.6 /100 | #220 | Tragic 35.8% |
| Dutch | 9.2 /100 | #221 | Tragic 35.7% |
| Trinidadians and Tobagonians | 8.8 /100 | #222 | Tragic 35.7% |
| French Canadians | 8.3 /100 | #223 | Tragic 35.6% |
| Immigrants | Barbados | 7.5 /100 | #224 | Tragic 35.5% |
| Immigrants | Burma/Myanmar | 7.3 /100 | #225 | Tragic 35.5% |
| Portuguese | 7.2 /100 | #226 | Tragic 35.5% |
Demographics Similar to Immigrants from Jordan by Bachelor's Degree
In terms of bachelor's degree, the demographic groups most similar to Immigrants from Jordan are Immigrants from Venezuela (40.2%, a difference of 0.17%), Immigrants from Eastern Africa (40.4%, a difference of 0.28%), British (40.4%, a difference of 0.33%), Serbian (40.1%, a difference of 0.35%), and Immigrants from Eritrea (40.4%, a difference of 0.36%).
| Demographics | Rating | Rank | Bachelor's Degree |
| Venezuelans | 94.7 /100 | #120 | Exceptional 40.5% |
| Moroccans | 94.6 /100 | #121 | Exceptional 40.5% |
| Immigrants | Albania | 94.4 /100 | #122 | Exceptional 40.4% |
| Lebanese | 94.3 /100 | #123 | Exceptional 40.4% |
| Immigrants | Eritrea | 94.3 /100 | #124 | Exceptional 40.4% |
| British | 94.2 /100 | #125 | Exceptional 40.4% |
| Immigrants | Eastern Africa | 94.1 /100 | #126 | Exceptional 40.4% |
| Immigrants | Jordan | 93.4 /100 | #127 | Exceptional 40.3% |
| Immigrants | Venezuela | 92.9 /100 | #128 | Exceptional 40.2% |
| Serbians | 92.4 /100 | #129 | Exceptional 40.1% |
| Sierra Leoneans | 92.2 /100 | #130 | Exceptional 40.1% |
| Italians | 91.9 /100 | #131 | Exceptional 40.1% |
| Taiwanese | 91.1 /100 | #132 | Exceptional 40.0% |
| Immigrants | Southern Europe | 91.1 /100 | #133 | Exceptional 40.0% |
| Assyrians/Chaldeans/Syriacs | 89.4 /100 | #134 | Excellent 39.8% |