Basque vs Immigrants from Switzerland Bachelor's Degree
COMPARE
Basque
Immigrants from Switzerland
Bachelor's Degree
Bachelor's Degree Comparison
Basques
Immigrants from Switzerland
37.7%
BACHELOR'S DEGREE
47.4/ 100
METRIC RATING
177th/ 347
METRIC RANK
47.1%
BACHELOR'S DEGREE
100.0/ 100
METRIC RATING
20th/ 347
METRIC RANK
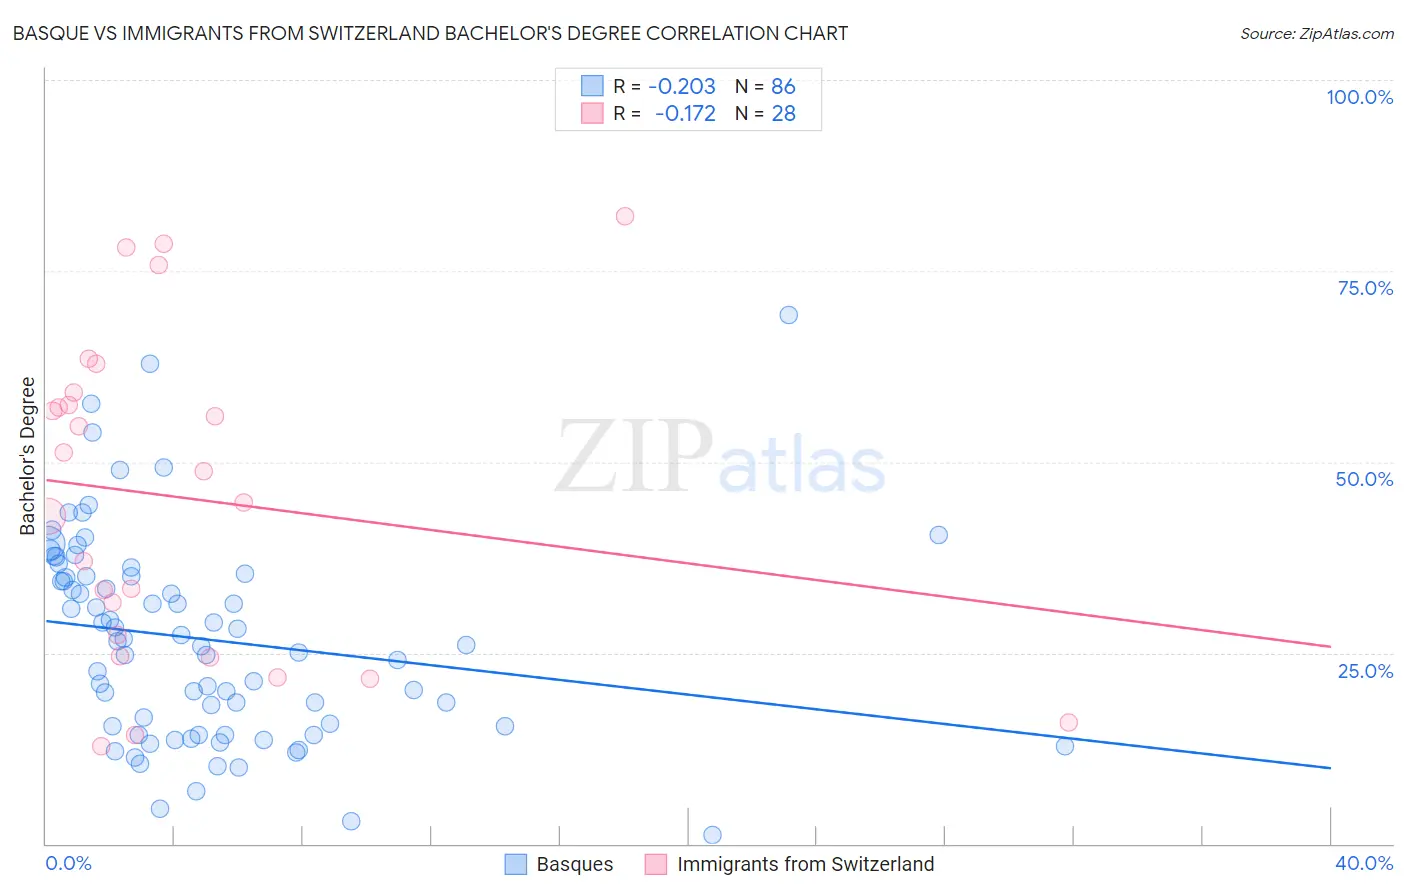
Basque vs Immigrants from Switzerland Bachelor's Degree Correlation Chart
The statistical analysis conducted on geographies consisting of 165,778,138 people shows a weak negative correlation between the proportion of Basques and percentage of population with at least bachelor's degree education in the United States with a correlation coefficient (R) of -0.203 and weighted average of 37.7%. Similarly, the statistical analysis conducted on geographies consisting of 148,083,391 people shows a poor negative correlation between the proportion of Immigrants from Switzerland and percentage of population with at least bachelor's degree education in the United States with a correlation coefficient (R) of -0.172 and weighted average of 47.1%, a difference of 24.9%.
Bachelor's Degree Correlation Summary
| Measurement | Basque | Immigrants from Switzerland |
| Minimum | 1.2% | 12.8% |
| Maximum | 69.2% | 82.2% |
| Range | 68.0% | 69.5% |
| Mean | 26.8% | 45.3% |
| Median | 26.3% | 46.7% |
| Interquartile 25% (IQ1) | 15.4% | 26.0% |
| Interquartile 75% (IQ3) | 35.0% | 58.3% |
| Interquartile Range (IQR) | 19.7% | 32.3% |
| Standard Deviation (Sample) | 13.5% | 20.8% |
| Standard Deviation (Population) | 13.4% | 20.4% |
Similar Demographics by Bachelor's Degree
Demographics Similar to Basques by Bachelor's Degree
In terms of bachelor's degree, the demographic groups most similar to Basques are Costa Rican (37.7%, a difference of 0.020%), Immigrants from Cameroon (37.7%, a difference of 0.060%), Immigrants from Uruguay (37.8%, a difference of 0.090%), Immigrants from Colombia (37.7%, a difference of 0.19%), and Immigrants from Bangladesh (37.8%, a difference of 0.25%).
| Demographics | Rating | Rank | Bachelor's Degree |
| Czechs | 54.4 /100 | #170 | Average 38.0% |
| Bermudans | 54.2 /100 | #171 | Average 38.0% |
| Immigrants | Somalia | 52.8 /100 | #172 | Average 37.9% |
| Immigrants | Iraq | 52.5 /100 | #173 | Average 37.9% |
| Immigrants | Bangladesh | 50.0 /100 | #174 | Average 37.8% |
| Immigrants | Uruguay | 48.3 /100 | #175 | Average 37.8% |
| Costa Ricans | 47.6 /100 | #176 | Average 37.7% |
| Basques | 47.4 /100 | #177 | Average 37.7% |
| Immigrants | Cameroon | 46.8 /100 | #178 | Average 37.7% |
| Immigrants | Colombia | 45.4 /100 | #179 | Average 37.7% |
| Irish | 44.3 /100 | #180 | Average 37.6% |
| Immigrants | Senegal | 43.8 /100 | #181 | Average 37.6% |
| Immigrants | Bosnia and Herzegovina | 43.4 /100 | #182 | Average 37.6% |
| Senegalese | 42.2 /100 | #183 | Average 37.5% |
| Scandinavians | 41.7 /100 | #184 | Average 37.5% |
Demographics Similar to Immigrants from Switzerland by Bachelor's Degree
In terms of bachelor's degree, the demographic groups most similar to Immigrants from Switzerland are Immigrants from Ireland (47.1%, a difference of 0.010%), Immigrants from Belgium (47.0%, a difference of 0.21%), Cambodian (47.2%, a difference of 0.22%), Immigrants from Sweden (47.0%, a difference of 0.30%), and Immigrants from Korea (47.0%, a difference of 0.34%).
| Demographics | Rating | Rank | Bachelor's Degree |
| Immigrants | South Central Asia | 100.0 /100 | #13 | Exceptional 48.3% |
| Immigrants | Hong Kong | 100.0 /100 | #14 | Exceptional 48.2% |
| Immigrants | Eastern Asia | 100.0 /100 | #15 | Exceptional 48.1% |
| Soviet Union | 100.0 /100 | #16 | Exceptional 47.9% |
| Eastern Europeans | 100.0 /100 | #17 | Exceptional 47.5% |
| Indians (Asian) | 100.0 /100 | #18 | Exceptional 47.4% |
| Cambodians | 100.0 /100 | #19 | Exceptional 47.2% |
| Immigrants | Switzerland | 100.0 /100 | #20 | Exceptional 47.1% |
| Immigrants | Ireland | 100.0 /100 | #21 | Exceptional 47.1% |
| Immigrants | Belgium | 100.0 /100 | #22 | Exceptional 47.0% |
| Immigrants | Sweden | 100.0 /100 | #23 | Exceptional 47.0% |
| Immigrants | Korea | 100.0 /100 | #24 | Exceptional 47.0% |
| Burmese | 100.0 /100 | #25 | Exceptional 46.9% |
| Immigrants | Japan | 100.0 /100 | #26 | Exceptional 46.8% |
| Immigrants | France | 100.0 /100 | #27 | Exceptional 46.4% |