Asian vs Immigrants from Jordan Bachelor's Degree
COMPARE
Asian
Immigrants from Jordan
Bachelor's Degree
Bachelor's Degree Comparison
Asians
Immigrants from Jordan
44.4%
BACHELOR'S DEGREE
99.9/ 100
METRIC RATING
51st/ 347
METRIC RANK
40.3%
BACHELOR'S DEGREE
93.4/ 100
METRIC RATING
127th/ 347
METRIC RANK
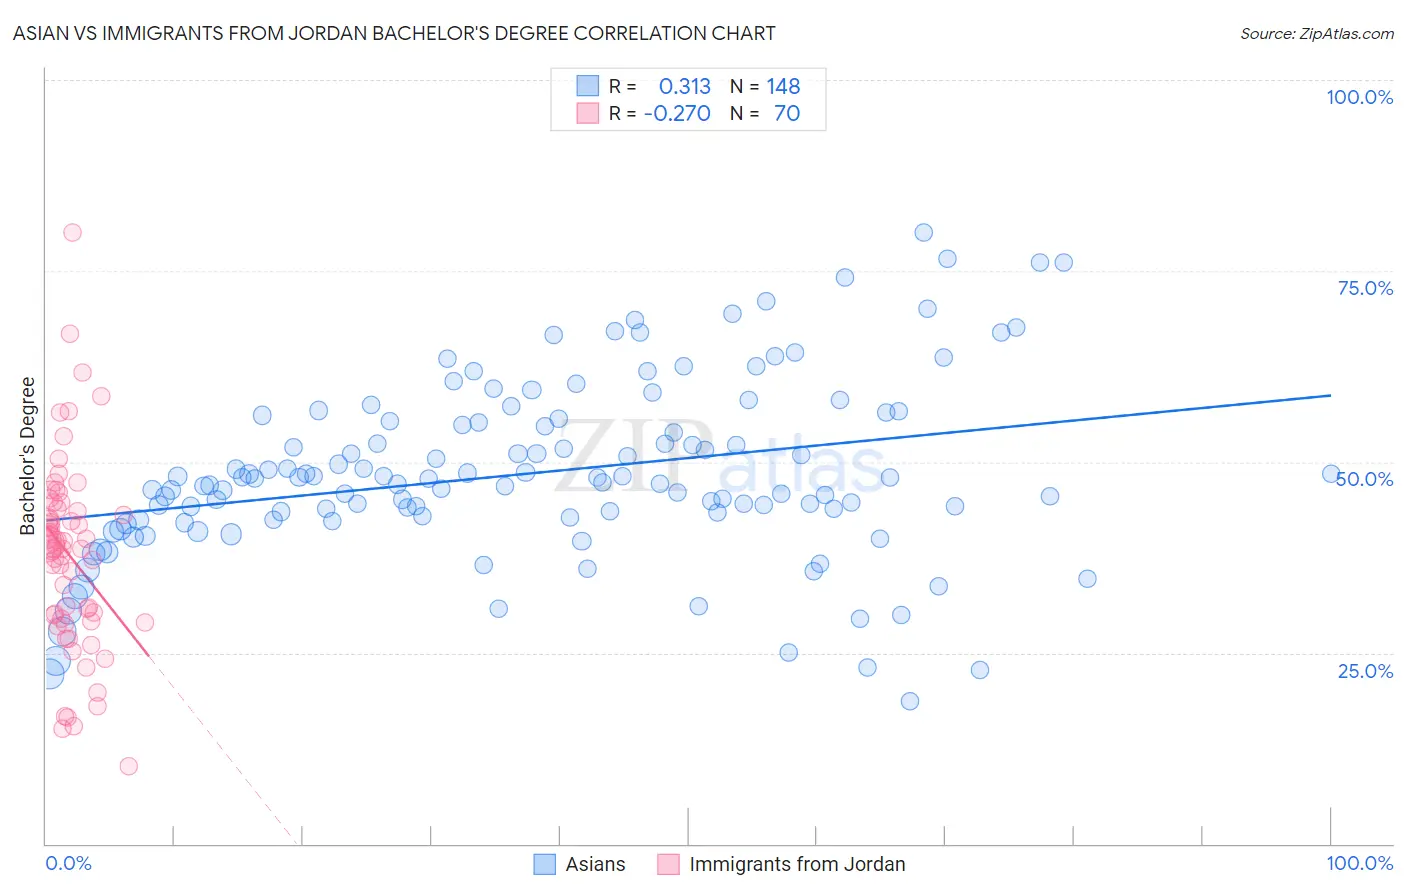
Asian vs Immigrants from Jordan Bachelor's Degree Correlation Chart
The statistical analysis conducted on geographies consisting of 550,793,799 people shows a mild positive correlation between the proportion of Asians and percentage of population with at least bachelor's degree education in the United States with a correlation coefficient (R) of 0.313 and weighted average of 44.4%. Similarly, the statistical analysis conducted on geographies consisting of 181,275,733 people shows a weak negative correlation between the proportion of Immigrants from Jordan and percentage of population with at least bachelor's degree education in the United States with a correlation coefficient (R) of -0.270 and weighted average of 40.3%, a difference of 10.3%.
Bachelor's Degree Correlation Summary
| Measurement | Asian | Immigrants from Jordan |
| Minimum | 18.6% | 10.2% |
| Maximum | 80.1% | 80.0% |
| Range | 61.5% | 69.8% |
| Mean | 48.5% | 37.8% |
| Median | 47.5% | 38.8% |
| Interquartile 25% (IQ1) | 42.5% | 29.5% |
| Interquartile 75% (IQ3) | 55.2% | 43.8% |
| Interquartile Range (IQR) | 12.7% | 14.3% |
| Standard Deviation (Sample) | 11.7% | 12.4% |
| Standard Deviation (Population) | 11.7% | 12.4% |
Similar Demographics by Bachelor's Degree
Demographics Similar to Asians by Bachelor's Degree
In terms of bachelor's degree, the demographic groups most similar to Asians are Immigrants from Greece (44.5%, a difference of 0.14%), Immigrants from Spain (44.3%, a difference of 0.18%), Immigrants from Asia (44.3%, a difference of 0.24%), Immigrants from Norway (44.5%, a difference of 0.25%), and Bolivian (44.6%, a difference of 0.38%).
| Demographics | Rating | Rank | Bachelor's Degree |
| Immigrants | Lithuania | 99.9 /100 | #44 | Exceptional 44.6% |
| Immigrants | Kuwait | 99.9 /100 | #45 | Exceptional 44.6% |
| Immigrants | Bulgaria | 99.9 /100 | #46 | Exceptional 44.6% |
| Bolivians | 99.9 /100 | #47 | Exceptional 44.6% |
| Estonians | 99.9 /100 | #48 | Exceptional 44.6% |
| Immigrants | Norway | 99.9 /100 | #49 | Exceptional 44.5% |
| Immigrants | Greece | 99.9 /100 | #50 | Exceptional 44.5% |
| Asians | 99.9 /100 | #51 | Exceptional 44.4% |
| Immigrants | Spain | 99.9 /100 | #52 | Exceptional 44.3% |
| Immigrants | Asia | 99.9 /100 | #53 | Exceptional 44.3% |
| Immigrants | Austria | 99.9 /100 | #54 | Exceptional 44.2% |
| Immigrants | Bolivia | 99.9 /100 | #55 | Exceptional 44.2% |
| Immigrants | Serbia | 99.9 /100 | #56 | Exceptional 44.1% |
| Paraguayans | 99.9 /100 | #57 | Exceptional 44.0% |
| Immigrants | Czechoslovakia | 99.9 /100 | #58 | Exceptional 44.0% |
Demographics Similar to Immigrants from Jordan by Bachelor's Degree
In terms of bachelor's degree, the demographic groups most similar to Immigrants from Jordan are Immigrants from Venezuela (40.2%, a difference of 0.17%), Immigrants from Eastern Africa (40.4%, a difference of 0.28%), British (40.4%, a difference of 0.33%), Serbian (40.1%, a difference of 0.35%), and Immigrants from Eritrea (40.4%, a difference of 0.36%).
| Demographics | Rating | Rank | Bachelor's Degree |
| Venezuelans | 94.7 /100 | #120 | Exceptional 40.5% |
| Moroccans | 94.6 /100 | #121 | Exceptional 40.5% |
| Immigrants | Albania | 94.4 /100 | #122 | Exceptional 40.4% |
| Lebanese | 94.3 /100 | #123 | Exceptional 40.4% |
| Immigrants | Eritrea | 94.3 /100 | #124 | Exceptional 40.4% |
| British | 94.2 /100 | #125 | Exceptional 40.4% |
| Immigrants | Eastern Africa | 94.1 /100 | #126 | Exceptional 40.4% |
| Immigrants | Jordan | 93.4 /100 | #127 | Exceptional 40.3% |
| Immigrants | Venezuela | 92.9 /100 | #128 | Exceptional 40.2% |
| Serbians | 92.4 /100 | #129 | Exceptional 40.1% |
| Sierra Leoneans | 92.2 /100 | #130 | Exceptional 40.1% |
| Italians | 91.9 /100 | #131 | Exceptional 40.1% |
| Taiwanese | 91.1 /100 | #132 | Exceptional 40.0% |
| Immigrants | Southern Europe | 91.1 /100 | #133 | Exceptional 40.0% |
| Assyrians/Chaldeans/Syriacs | 89.4 /100 | #134 | Excellent 39.8% |