Apache vs Immigrants from Zimbabwe High School Diploma
COMPARE
Apache
Immigrants from Zimbabwe
High School Diploma
High School Diploma Comparison
Apache
Immigrants from Zimbabwe
85.1%
HIGH SCHOOL DIPLOMA
0.0/ 100
METRIC RATING
310th/ 347
METRIC RANK
90.3%
HIGH SCHOOL DIPLOMA
96.7/ 100
METRIC RATING
109th/ 347
METRIC RANK
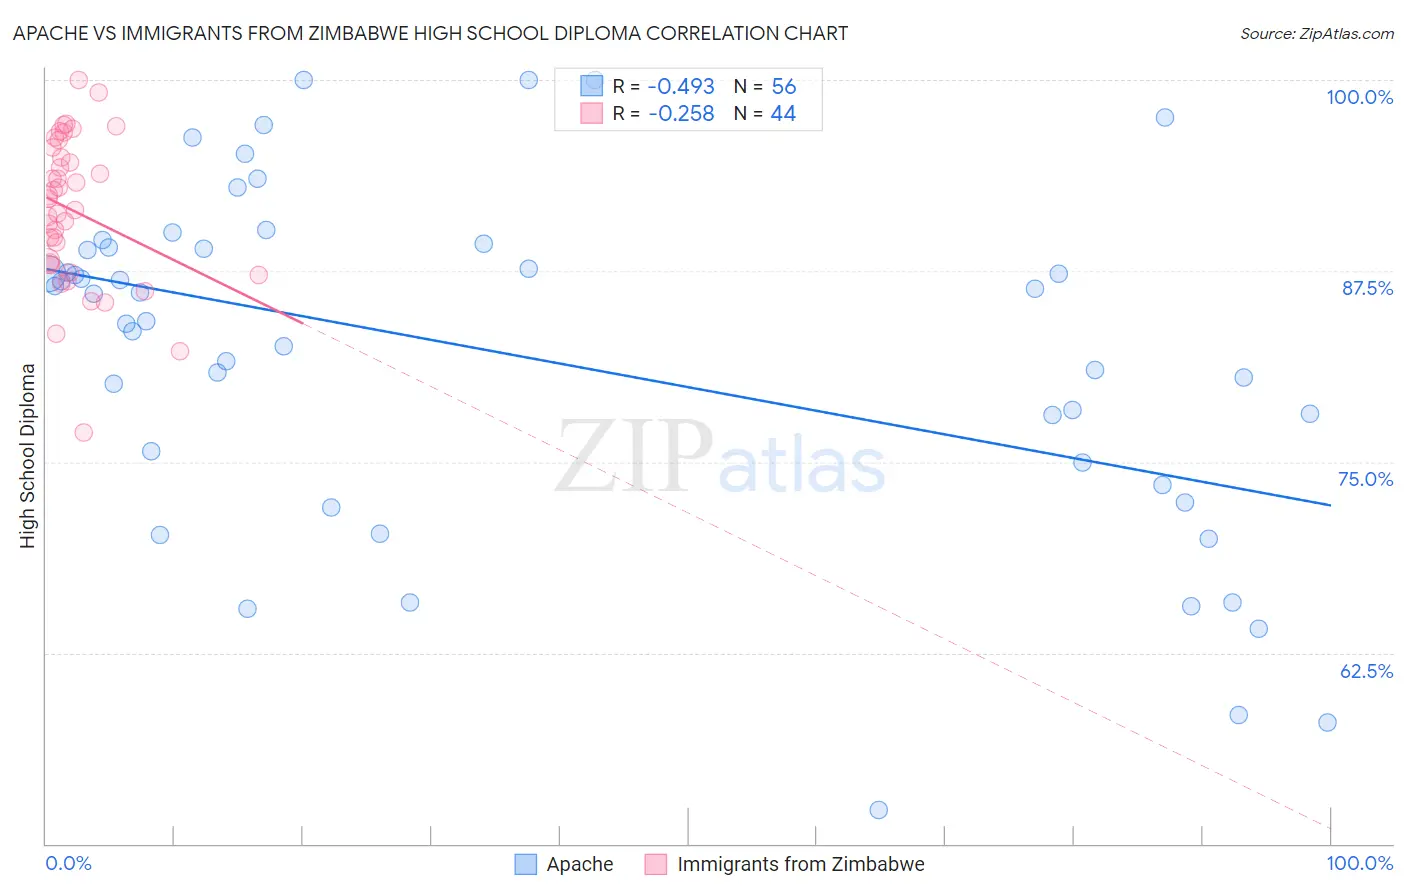
Apache vs Immigrants from Zimbabwe High School Diploma Correlation Chart
The statistical analysis conducted on geographies consisting of 231,143,094 people shows a moderate negative correlation between the proportion of Apache and percentage of population with at least high school diploma education in the United States with a correlation coefficient (R) of -0.493 and weighted average of 85.1%. Similarly, the statistical analysis conducted on geographies consisting of 117,809,864 people shows a weak negative correlation between the proportion of Immigrants from Zimbabwe and percentage of population with at least high school diploma education in the United States with a correlation coefficient (R) of -0.258 and weighted average of 90.3%, a difference of 6.1%.
High School Diploma Correlation Summary
| Measurement | Apache | Immigrants from Zimbabwe |
| Minimum | 52.2% | 76.9% |
| Maximum | 100.0% | 100.0% |
| Range | 47.8% | 23.1% |
| Mean | 81.9% | 91.4% |
| Median | 85.1% | 91.9% |
| Interquartile 25% (IQ1) | 74.2% | 88.0% |
| Interquartile 75% (IQ3) | 89.0% | 95.3% |
| Interquartile Range (IQR) | 14.8% | 7.3% |
| Standard Deviation (Sample) | 11.3% | 4.8% |
| Standard Deviation (Population) | 11.2% | 4.8% |
Similar Demographics by High School Diploma
Demographics Similar to Apache by High School Diploma
In terms of high school diploma, the demographic groups most similar to Apache are Ecuadorian (85.1%, a difference of 0.010%), Cape Verdean (85.1%, a difference of 0.060%), Immigrants from Dominica (85.2%, a difference of 0.080%), Immigrants from Armenia (85.2%, a difference of 0.090%), and Navajo (85.2%, a difference of 0.10%).
| Demographics | Rating | Rank | High School Diploma |
| Cubans | 0.0 /100 | #303 | Tragic 85.4% |
| Nepalese | 0.0 /100 | #304 | Tragic 85.3% |
| Immigrants | Portugal | 0.0 /100 | #305 | Tragic 85.3% |
| Immigrants | Guyana | 0.0 /100 | #306 | Tragic 85.3% |
| Navajo | 0.0 /100 | #307 | Tragic 85.2% |
| Immigrants | Armenia | 0.0 /100 | #308 | Tragic 85.2% |
| Immigrants | Dominica | 0.0 /100 | #309 | Tragic 85.2% |
| Apache | 0.0 /100 | #310 | Tragic 85.1% |
| Ecuadorians | 0.0 /100 | #311 | Tragic 85.1% |
| Cape Verdeans | 0.0 /100 | #312 | Tragic 85.1% |
| Immigrants | Ecuador | 0.0 /100 | #313 | Tragic 84.8% |
| Yaqui | 0.0 /100 | #314 | Tragic 84.7% |
| Puerto Ricans | 0.0 /100 | #315 | Tragic 84.7% |
| Belizeans | 0.0 /100 | #316 | Tragic 84.3% |
| Immigrants | Caribbean | 0.0 /100 | #317 | Tragic 84.3% |
Demographics Similar to Immigrants from Zimbabwe by High School Diploma
In terms of high school diploma, the demographic groups most similar to Immigrants from Zimbabwe are Palestinian (90.3%, a difference of 0.0%), Immigrants from Greece (90.3%, a difference of 0.010%), Menominee (90.3%, a difference of 0.010%), Immigrants from Russia (90.3%, a difference of 0.020%), and Syrian (90.3%, a difference of 0.030%).
| Demographics | Rating | Rank | High School Diploma |
| Aleuts | 98.0 /100 | #102 | Exceptional 90.4% |
| Immigrants | Romania | 97.8 /100 | #103 | Exceptional 90.4% |
| Immigrants | Croatia | 97.8 /100 | #104 | Exceptional 90.4% |
| Lebanese | 97.4 /100 | #105 | Exceptional 90.4% |
| Syrians | 97.0 /100 | #106 | Exceptional 90.3% |
| Immigrants | Russia | 96.9 /100 | #107 | Exceptional 90.3% |
| Palestinians | 96.7 /100 | #108 | Exceptional 90.3% |
| Immigrants | Zimbabwe | 96.7 /100 | #109 | Exceptional 90.3% |
| Immigrants | Greece | 96.6 /100 | #110 | Exceptional 90.3% |
| Menominee | 96.6 /100 | #111 | Exceptional 90.3% |
| Immigrants | Belarus | 96.4 /100 | #112 | Exceptional 90.2% |
| Immigrants | Sri Lanka | 96.3 /100 | #113 | Exceptional 90.2% |
| Yugoslavians | 96.2 /100 | #114 | Exceptional 90.2% |
| Immigrants | Hungary | 95.8 /100 | #115 | Exceptional 90.2% |
| Immigrants | Germany | 95.7 /100 | #116 | Exceptional 90.2% |