American vs Immigrants from Zimbabwe High School Diploma
COMPARE
American
Immigrants from Zimbabwe
High School Diploma
High School Diploma Comparison
Americans
Immigrants from Zimbabwe
89.1%
HIGH SCHOOL DIPLOMA
47.2/ 100
METRIC RATING
179th/ 347
METRIC RANK
90.3%
HIGH SCHOOL DIPLOMA
96.7/ 100
METRIC RATING
109th/ 347
METRIC RANK
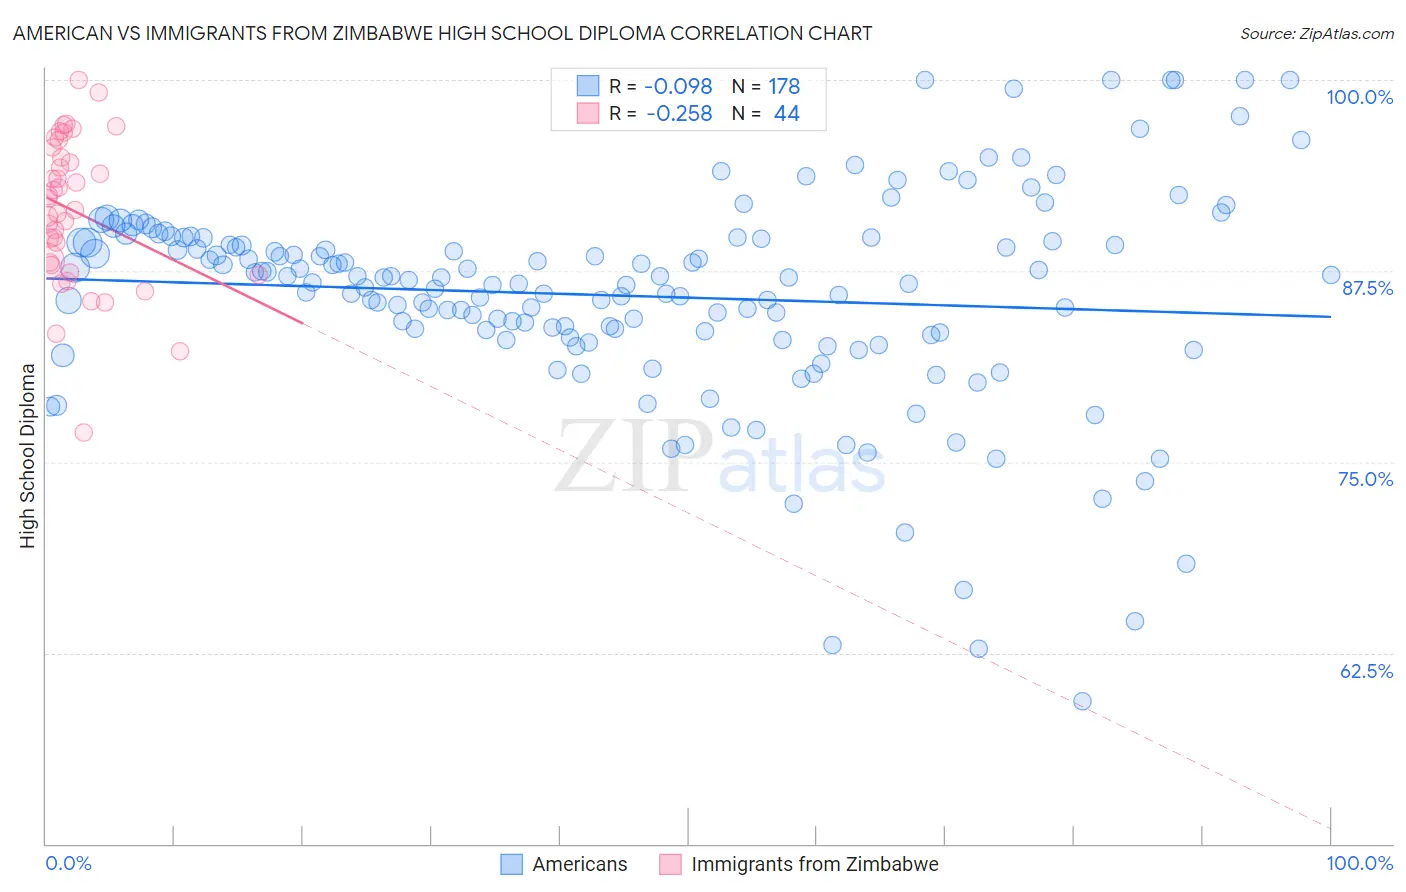
American vs Immigrants from Zimbabwe High School Diploma Correlation Chart
The statistical analysis conducted on geographies consisting of 581,993,169 people shows a slight negative correlation between the proportion of Americans and percentage of population with at least high school diploma education in the United States with a correlation coefficient (R) of -0.098 and weighted average of 89.1%. Similarly, the statistical analysis conducted on geographies consisting of 117,809,864 people shows a weak negative correlation between the proportion of Immigrants from Zimbabwe and percentage of population with at least high school diploma education in the United States with a correlation coefficient (R) of -0.258 and weighted average of 90.3%, a difference of 1.3%.
High School Diploma Correlation Summary
| Measurement | American | Immigrants from Zimbabwe |
| Minimum | 59.3% | 76.9% |
| Maximum | 100.0% | 100.0% |
| Range | 40.7% | 23.1% |
| Mean | 85.9% | 91.4% |
| Median | 86.8% | 91.9% |
| Interquartile 25% (IQ1) | 83.3% | 88.0% |
| Interquartile 75% (IQ3) | 89.4% | 95.3% |
| Interquartile Range (IQR) | 6.1% | 7.3% |
| Standard Deviation (Sample) | 6.9% | 4.8% |
| Standard Deviation (Population) | 6.9% | 4.8% |
Similar Demographics by High School Diploma
Demographics Similar to Americans by High School Diploma
In terms of high school diploma, the demographic groups most similar to Americans are Osage (89.1%, a difference of 0.020%), Sudanese (89.1%, a difference of 0.020%), Sierra Leonean (89.1%, a difference of 0.020%), Immigrants from Western Asia (89.1%, a difference of 0.030%), and Bolivian (89.1%, a difference of 0.030%).
| Demographics | Rating | Rank | High School Diploma |
| Immigrants | Nonimmigrants | 51.8 /100 | #172 | Average 89.2% |
| Immigrants | Indonesia | 50.3 /100 | #173 | Average 89.1% |
| Hmong | 50.0 /100 | #174 | Average 89.1% |
| Immigrants | Western Asia | 49.0 /100 | #175 | Average 89.1% |
| Osage | 48.9 /100 | #176 | Average 89.1% |
| Sudanese | 48.5 /100 | #177 | Average 89.1% |
| Sierra Leoneans | 48.4 /100 | #178 | Average 89.1% |
| Americans | 47.2 /100 | #179 | Average 89.1% |
| Bolivians | 45.2 /100 | #180 | Average 89.1% |
| Venezuelans | 43.6 /100 | #181 | Average 89.1% |
| Spaniards | 43.4 /100 | #182 | Average 89.1% |
| Potawatomi | 42.5 /100 | #183 | Average 89.0% |
| Immigrants | Syria | 39.2 /100 | #184 | Fair 89.0% |
| Ethiopians | 37.0 /100 | #185 | Fair 89.0% |
| Immigrants | Eastern Africa | 35.8 /100 | #186 | Fair 88.9% |
Demographics Similar to Immigrants from Zimbabwe by High School Diploma
In terms of high school diploma, the demographic groups most similar to Immigrants from Zimbabwe are Palestinian (90.3%, a difference of 0.0%), Immigrants from Greece (90.3%, a difference of 0.010%), Menominee (90.3%, a difference of 0.010%), Immigrants from Russia (90.3%, a difference of 0.020%), and Syrian (90.3%, a difference of 0.030%).
| Demographics | Rating | Rank | High School Diploma |
| Aleuts | 98.0 /100 | #102 | Exceptional 90.4% |
| Immigrants | Romania | 97.8 /100 | #103 | Exceptional 90.4% |
| Immigrants | Croatia | 97.8 /100 | #104 | Exceptional 90.4% |
| Lebanese | 97.4 /100 | #105 | Exceptional 90.4% |
| Syrians | 97.0 /100 | #106 | Exceptional 90.3% |
| Immigrants | Russia | 96.9 /100 | #107 | Exceptional 90.3% |
| Palestinians | 96.7 /100 | #108 | Exceptional 90.3% |
| Immigrants | Zimbabwe | 96.7 /100 | #109 | Exceptional 90.3% |
| Immigrants | Greece | 96.6 /100 | #110 | Exceptional 90.3% |
| Menominee | 96.6 /100 | #111 | Exceptional 90.3% |
| Immigrants | Belarus | 96.4 /100 | #112 | Exceptional 90.2% |
| Immigrants | Sri Lanka | 96.3 /100 | #113 | Exceptional 90.2% |
| Yugoslavians | 96.2 /100 | #114 | Exceptional 90.2% |
| Immigrants | Hungary | 95.8 /100 | #115 | Exceptional 90.2% |
| Immigrants | Germany | 95.7 /100 | #116 | Exceptional 90.2% |