Apache vs Immigrants from Norway High School Diploma
COMPARE
Apache
Immigrants from Norway
High School Diploma
High School Diploma Comparison
Apache
Immigrants from Norway
85.1%
HIGH SCHOOL DIPLOMA
0.0/ 100
METRIC RATING
310th/ 347
METRIC RANK
90.5%
HIGH SCHOOL DIPLOMA
98.0/ 100
METRIC RATING
101st/ 347
METRIC RANK
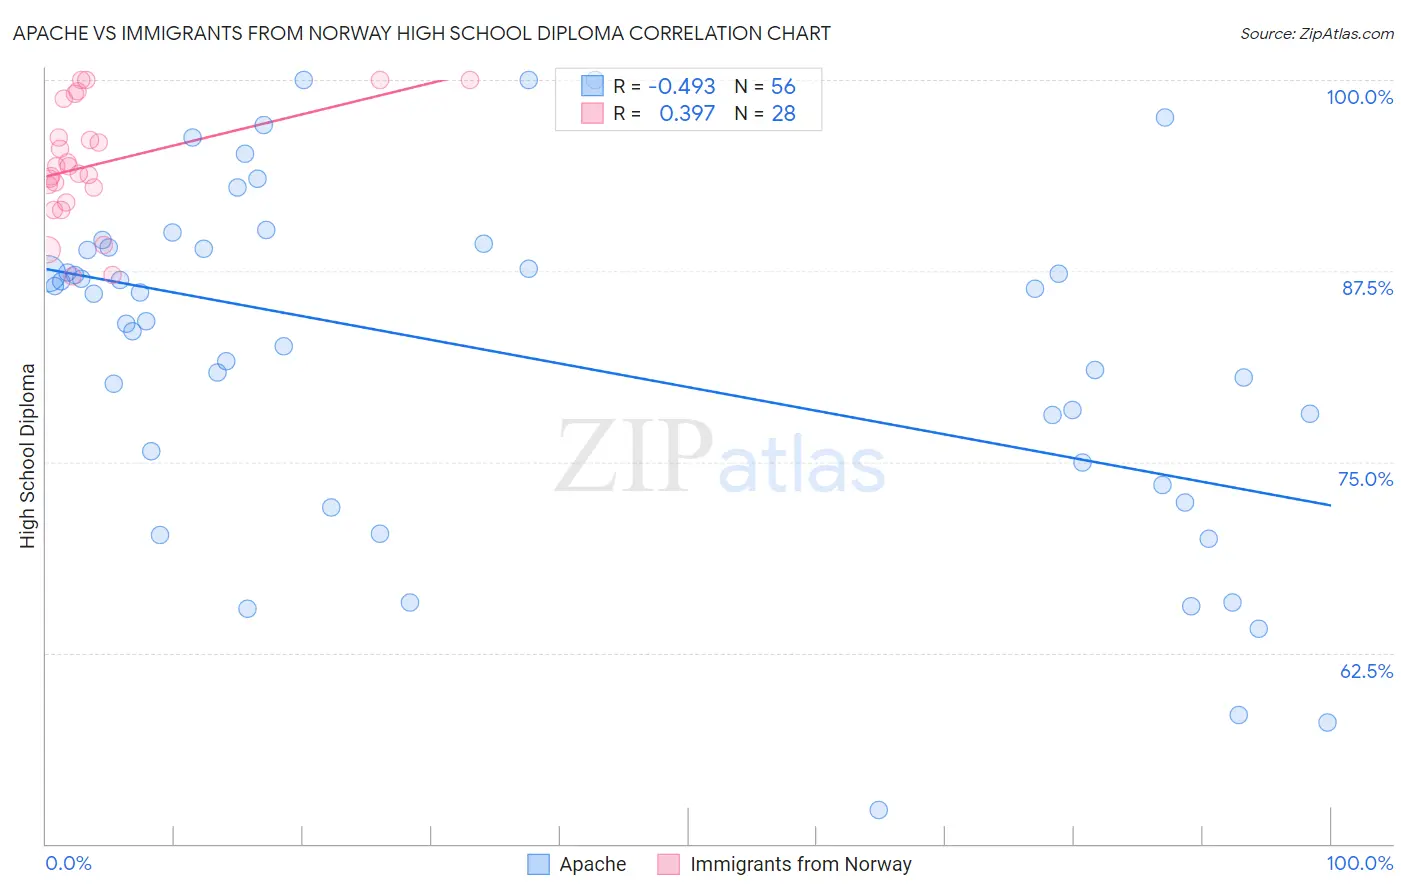
Apache vs Immigrants from Norway High School Diploma Correlation Chart
The statistical analysis conducted on geographies consisting of 231,143,094 people shows a moderate negative correlation between the proportion of Apache and percentage of population with at least high school diploma education in the United States with a correlation coefficient (R) of -0.493 and weighted average of 85.1%. Similarly, the statistical analysis conducted on geographies consisting of 116,716,356 people shows a mild positive correlation between the proportion of Immigrants from Norway and percentage of population with at least high school diploma education in the United States with a correlation coefficient (R) of 0.397 and weighted average of 90.5%, a difference of 6.3%.
High School Diploma Correlation Summary
| Measurement | Apache | Immigrants from Norway |
| Minimum | 52.2% | 87.1% |
| Maximum | 100.0% | 100.0% |
| Range | 47.8% | 12.9% |
| Mean | 81.9% | 94.5% |
| Median | 85.1% | 94.1% |
| Interquartile 25% (IQ1) | 74.2% | 92.4% |
| Interquartile 75% (IQ3) | 89.0% | 97.5% |
| Interquartile Range (IQR) | 14.8% | 5.1% |
| Standard Deviation (Sample) | 11.3% | 3.8% |
| Standard Deviation (Population) | 11.2% | 3.7% |
Similar Demographics by High School Diploma
Demographics Similar to Apache by High School Diploma
In terms of high school diploma, the demographic groups most similar to Apache are Ecuadorian (85.1%, a difference of 0.010%), Cape Verdean (85.1%, a difference of 0.060%), Immigrants from Dominica (85.2%, a difference of 0.080%), Immigrants from Armenia (85.2%, a difference of 0.090%), and Navajo (85.2%, a difference of 0.10%).
| Demographics | Rating | Rank | High School Diploma |
| Cubans | 0.0 /100 | #303 | Tragic 85.4% |
| Nepalese | 0.0 /100 | #304 | Tragic 85.3% |
| Immigrants | Portugal | 0.0 /100 | #305 | Tragic 85.3% |
| Immigrants | Guyana | 0.0 /100 | #306 | Tragic 85.3% |
| Navajo | 0.0 /100 | #307 | Tragic 85.2% |
| Immigrants | Armenia | 0.0 /100 | #308 | Tragic 85.2% |
| Immigrants | Dominica | 0.0 /100 | #309 | Tragic 85.2% |
| Apache | 0.0 /100 | #310 | Tragic 85.1% |
| Ecuadorians | 0.0 /100 | #311 | Tragic 85.1% |
| Cape Verdeans | 0.0 /100 | #312 | Tragic 85.1% |
| Immigrants | Ecuador | 0.0 /100 | #313 | Tragic 84.8% |
| Yaqui | 0.0 /100 | #314 | Tragic 84.7% |
| Puerto Ricans | 0.0 /100 | #315 | Tragic 84.7% |
| Belizeans | 0.0 /100 | #316 | Tragic 84.3% |
| Immigrants | Caribbean | 0.0 /100 | #317 | Tragic 84.3% |
Demographics Similar to Immigrants from Norway by High School Diploma
In terms of high school diploma, the demographic groups most similar to Immigrants from Norway are Aleut (90.4%, a difference of 0.010%), Immigrants from North Macedonia (90.5%, a difference of 0.020%), Immigrants from Europe (90.5%, a difference of 0.030%), Immigrants from Romania (90.4%, a difference of 0.030%), and Immigrants from Croatia (90.4%, a difference of 0.040%).
| Demographics | Rating | Rank | High School Diploma |
| Immigrants | Israel | 98.5 /100 | #94 | Exceptional 90.5% |
| Icelanders | 98.5 /100 | #95 | Exceptional 90.5% |
| Immigrants | Serbia | 98.4 /100 | #96 | Exceptional 90.5% |
| Immigrants | Kuwait | 98.3 /100 | #97 | Exceptional 90.5% |
| Immigrants | Korea | 98.3 /100 | #98 | Exceptional 90.5% |
| Immigrants | Europe | 98.2 /100 | #99 | Exceptional 90.5% |
| Immigrants | North Macedonia | 98.1 /100 | #100 | Exceptional 90.5% |
| Immigrants | Norway | 98.0 /100 | #101 | Exceptional 90.5% |
| Aleuts | 98.0 /100 | #102 | Exceptional 90.4% |
| Immigrants | Romania | 97.8 /100 | #103 | Exceptional 90.4% |
| Immigrants | Croatia | 97.8 /100 | #104 | Exceptional 90.4% |
| Lebanese | 97.4 /100 | #105 | Exceptional 90.4% |
| Syrians | 97.0 /100 | #106 | Exceptional 90.3% |
| Immigrants | Russia | 96.9 /100 | #107 | Exceptional 90.3% |
| Palestinians | 96.7 /100 | #108 | Exceptional 90.3% |