Apache vs Immigrants from Spain High School Diploma
COMPARE
Apache
Immigrants from Spain
High School Diploma
High School Diploma Comparison
Apache
Immigrants from Spain
85.1%
HIGH SCHOOL DIPLOMA
0.0/ 100
METRIC RATING
310th/ 347
METRIC RANK
89.5%
HIGH SCHOOL DIPLOMA
76.2/ 100
METRIC RATING
146th/ 347
METRIC RANK
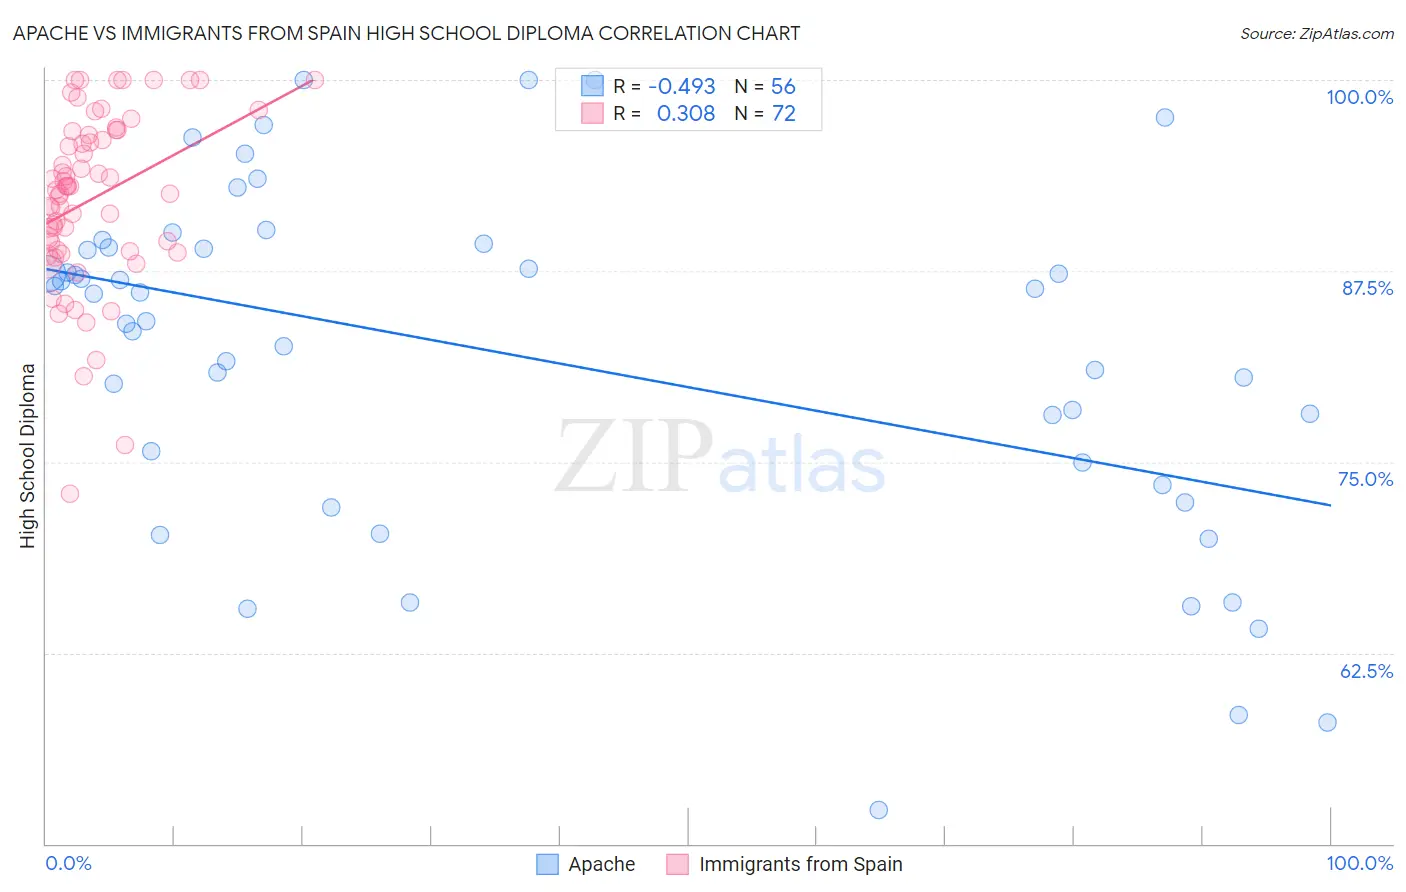
Apache vs Immigrants from Spain High School Diploma Correlation Chart
The statistical analysis conducted on geographies consisting of 231,143,094 people shows a moderate negative correlation between the proportion of Apache and percentage of population with at least high school diploma education in the United States with a correlation coefficient (R) of -0.493 and weighted average of 85.1%. Similarly, the statistical analysis conducted on geographies consisting of 239,682,725 people shows a mild positive correlation between the proportion of Immigrants from Spain and percentage of population with at least high school diploma education in the United States with a correlation coefficient (R) of 0.308 and weighted average of 89.5%, a difference of 5.2%.
High School Diploma Correlation Summary
| Measurement | Apache | Immigrants from Spain |
| Minimum | 52.2% | 72.9% |
| Maximum | 100.0% | 100.0% |
| Range | 47.8% | 27.1% |
| Mean | 81.9% | 92.2% |
| Median | 85.1% | 92.9% |
| Interquartile 25% (IQ1) | 74.2% | 88.8% |
| Interquartile 75% (IQ3) | 89.0% | 96.5% |
| Interquartile Range (IQR) | 14.8% | 7.7% |
| Standard Deviation (Sample) | 11.3% | 5.6% |
| Standard Deviation (Population) | 11.2% | 5.6% |
Similar Demographics by High School Diploma
Demographics Similar to Apache by High School Diploma
In terms of high school diploma, the demographic groups most similar to Apache are Ecuadorian (85.1%, a difference of 0.010%), Cape Verdean (85.1%, a difference of 0.060%), Immigrants from Dominica (85.2%, a difference of 0.080%), Immigrants from Armenia (85.2%, a difference of 0.090%), and Navajo (85.2%, a difference of 0.10%).
| Demographics | Rating | Rank | High School Diploma |
| Cubans | 0.0 /100 | #303 | Tragic 85.4% |
| Nepalese | 0.0 /100 | #304 | Tragic 85.3% |
| Immigrants | Portugal | 0.0 /100 | #305 | Tragic 85.3% |
| Immigrants | Guyana | 0.0 /100 | #306 | Tragic 85.3% |
| Navajo | 0.0 /100 | #307 | Tragic 85.2% |
| Immigrants | Armenia | 0.0 /100 | #308 | Tragic 85.2% |
| Immigrants | Dominica | 0.0 /100 | #309 | Tragic 85.2% |
| Apache | 0.0 /100 | #310 | Tragic 85.1% |
| Ecuadorians | 0.0 /100 | #311 | Tragic 85.1% |
| Cape Verdeans | 0.0 /100 | #312 | Tragic 85.1% |
| Immigrants | Ecuador | 0.0 /100 | #313 | Tragic 84.8% |
| Yaqui | 0.0 /100 | #314 | Tragic 84.7% |
| Puerto Ricans | 0.0 /100 | #315 | Tragic 84.7% |
| Belizeans | 0.0 /100 | #316 | Tragic 84.3% |
| Immigrants | Caribbean | 0.0 /100 | #317 | Tragic 84.3% |
Demographics Similar to Immigrants from Spain by High School Diploma
In terms of high school diploma, the demographic groups most similar to Immigrants from Spain are Immigrants from Brazil (89.5%, a difference of 0.010%), Immigrants from Kenya (89.6%, a difference of 0.040%), Pakistani (89.6%, a difference of 0.050%), Iraqi (89.5%, a difference of 0.050%), and Chilean (89.6%, a difference of 0.060%).
| Demographics | Rating | Rank | High School Diploma |
| Kenyans | 81.4 /100 | #139 | Excellent 89.6% |
| Immigrants | Egypt | 81.2 /100 | #140 | Excellent 89.6% |
| Chileans | 79.0 /100 | #141 | Good 89.6% |
| Indians (Asian) | 78.8 /100 | #142 | Good 89.6% |
| Pakistanis | 78.3 /100 | #143 | Good 89.6% |
| Immigrants | Kenya | 78.0 /100 | #144 | Good 89.6% |
| Immigrants | Brazil | 76.6 /100 | #145 | Good 89.5% |
| Immigrants | Spain | 76.2 /100 | #146 | Good 89.5% |
| Iraqis | 73.9 /100 | #147 | Good 89.5% |
| Immigrants | Lebanon | 73.4 /100 | #148 | Good 89.5% |
| Immigrants | Poland | 72.9 /100 | #149 | Good 89.5% |
| Argentineans | 72.3 /100 | #150 | Good 89.5% |
| Paraguayans | 71.4 /100 | #151 | Good 89.5% |
| Asians | 70.7 /100 | #152 | Good 89.4% |
| Immigrants | Iraq | 68.7 /100 | #153 | Good 89.4% |