Apache vs Uruguayan High School Diploma
COMPARE
Apache
Uruguayan
High School Diploma
High School Diploma Comparison
Apache
Uruguayans
85.1%
HIGH SCHOOL DIPLOMA
0.0/ 100
METRIC RATING
310th/ 347
METRIC RANK
88.2%
HIGH SCHOOL DIPLOMA
5.6/ 100
METRIC RATING
226th/ 347
METRIC RANK
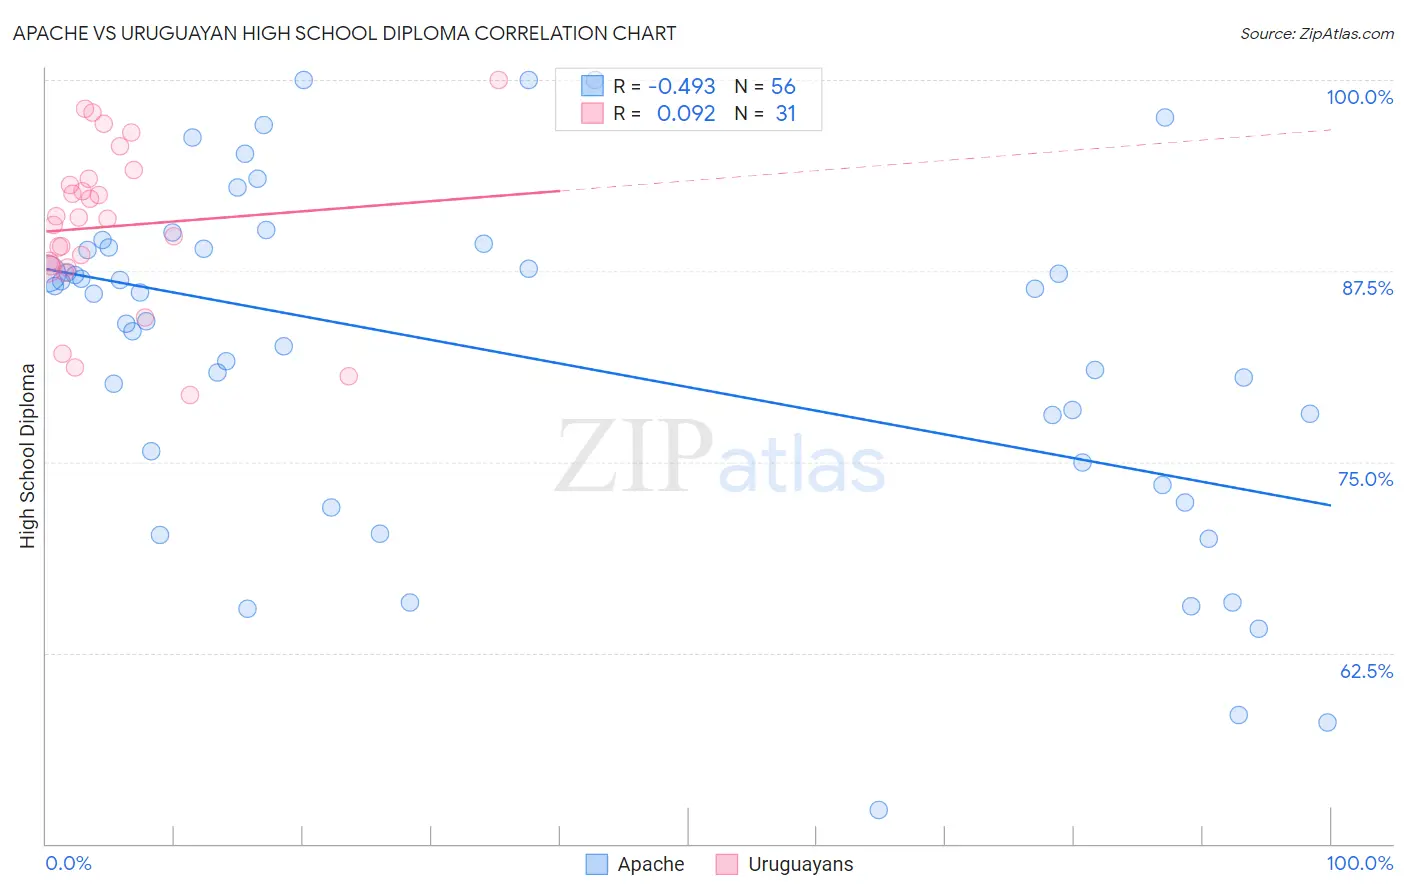
Apache vs Uruguayan High School Diploma Correlation Chart
The statistical analysis conducted on geographies consisting of 231,143,094 people shows a moderate negative correlation between the proportion of Apache and percentage of population with at least high school diploma education in the United States with a correlation coefficient (R) of -0.493 and weighted average of 85.1%. Similarly, the statistical analysis conducted on geographies consisting of 144,782,615 people shows a slight positive correlation between the proportion of Uruguayans and percentage of population with at least high school diploma education in the United States with a correlation coefficient (R) of 0.092 and weighted average of 88.2%, a difference of 3.6%.
High School Diploma Correlation Summary
| Measurement | Apache | Uruguayan |
| Minimum | 52.2% | 79.4% |
| Maximum | 100.0% | 100.0% |
| Range | 47.8% | 20.6% |
| Mean | 81.9% | 90.4% |
| Median | 85.1% | 90.9% |
| Interquartile 25% (IQ1) | 74.2% | 87.7% |
| Interquartile 75% (IQ3) | 89.0% | 93.5% |
| Interquartile Range (IQR) | 14.8% | 5.8% |
| Standard Deviation (Sample) | 11.3% | 5.2% |
| Standard Deviation (Population) | 11.2% | 5.1% |
Similar Demographics by High School Diploma
Demographics Similar to Apache by High School Diploma
In terms of high school diploma, the demographic groups most similar to Apache are Ecuadorian (85.1%, a difference of 0.010%), Cape Verdean (85.1%, a difference of 0.060%), Immigrants from Dominica (85.2%, a difference of 0.080%), Immigrants from Armenia (85.2%, a difference of 0.090%), and Navajo (85.2%, a difference of 0.10%).
| Demographics | Rating | Rank | High School Diploma |
| Cubans | 0.0 /100 | #303 | Tragic 85.4% |
| Nepalese | 0.0 /100 | #304 | Tragic 85.3% |
| Immigrants | Portugal | 0.0 /100 | #305 | Tragic 85.3% |
| Immigrants | Guyana | 0.0 /100 | #306 | Tragic 85.3% |
| Navajo | 0.0 /100 | #307 | Tragic 85.2% |
| Immigrants | Armenia | 0.0 /100 | #308 | Tragic 85.2% |
| Immigrants | Dominica | 0.0 /100 | #309 | Tragic 85.2% |
| Apache | 0.0 /100 | #310 | Tragic 85.1% |
| Ecuadorians | 0.0 /100 | #311 | Tragic 85.1% |
| Cape Verdeans | 0.0 /100 | #312 | Tragic 85.1% |
| Immigrants | Ecuador | 0.0 /100 | #313 | Tragic 84.8% |
| Yaqui | 0.0 /100 | #314 | Tragic 84.7% |
| Puerto Ricans | 0.0 /100 | #315 | Tragic 84.7% |
| Belizeans | 0.0 /100 | #316 | Tragic 84.3% |
| Immigrants | Caribbean | 0.0 /100 | #317 | Tragic 84.3% |
Demographics Similar to Uruguayans by High School Diploma
In terms of high school diploma, the demographic groups most similar to Uruguayans are Immigrants from Liberia (88.2%, a difference of 0.010%), Kiowa (88.2%, a difference of 0.020%), Nigerian (88.2%, a difference of 0.030%), Creek (88.3%, a difference of 0.080%), and Shoshone (88.3%, a difference of 0.090%).
| Demographics | Rating | Rank | High School Diploma |
| Costa Ricans | 9.6 /100 | #219 | Tragic 88.4% |
| Tongans | 9.5 /100 | #220 | Tragic 88.4% |
| Immigrants | Afghanistan | 8.6 /100 | #221 | Tragic 88.3% |
| Colville | 7.8 /100 | #222 | Tragic 88.3% |
| Immigrants | Zaire | 7.6 /100 | #223 | Tragic 88.3% |
| Shoshone | 7.0 /100 | #224 | Tragic 88.3% |
| Creek | 6.9 /100 | #225 | Tragic 88.3% |
| Uruguayans | 5.6 /100 | #226 | Tragic 88.2% |
| Immigrants | Liberia | 5.5 /100 | #227 | Tragic 88.2% |
| Kiowa | 5.3 /100 | #228 | Tragic 88.2% |
| Nigerians | 5.2 /100 | #229 | Tragic 88.2% |
| Blackfeet | 4.2 /100 | #230 | Tragic 88.1% |
| Colombians | 3.8 /100 | #231 | Tragic 88.1% |
| Immigrants | Middle Africa | 3.4 /100 | #232 | Tragic 88.0% |
| Immigrants | Panama | 3.1 /100 | #233 | Tragic 88.0% |