Apache vs Afghan High School Diploma
COMPARE
Apache
Afghan
High School Diploma
High School Diploma Comparison
Apache
Afghans
85.1%
HIGH SCHOOL DIPLOMA
0.0/ 100
METRIC RATING
310th/ 347
METRIC RANK
88.8%
HIGH SCHOOL DIPLOMA
23.9/ 100
METRIC RATING
195th/ 347
METRIC RANK
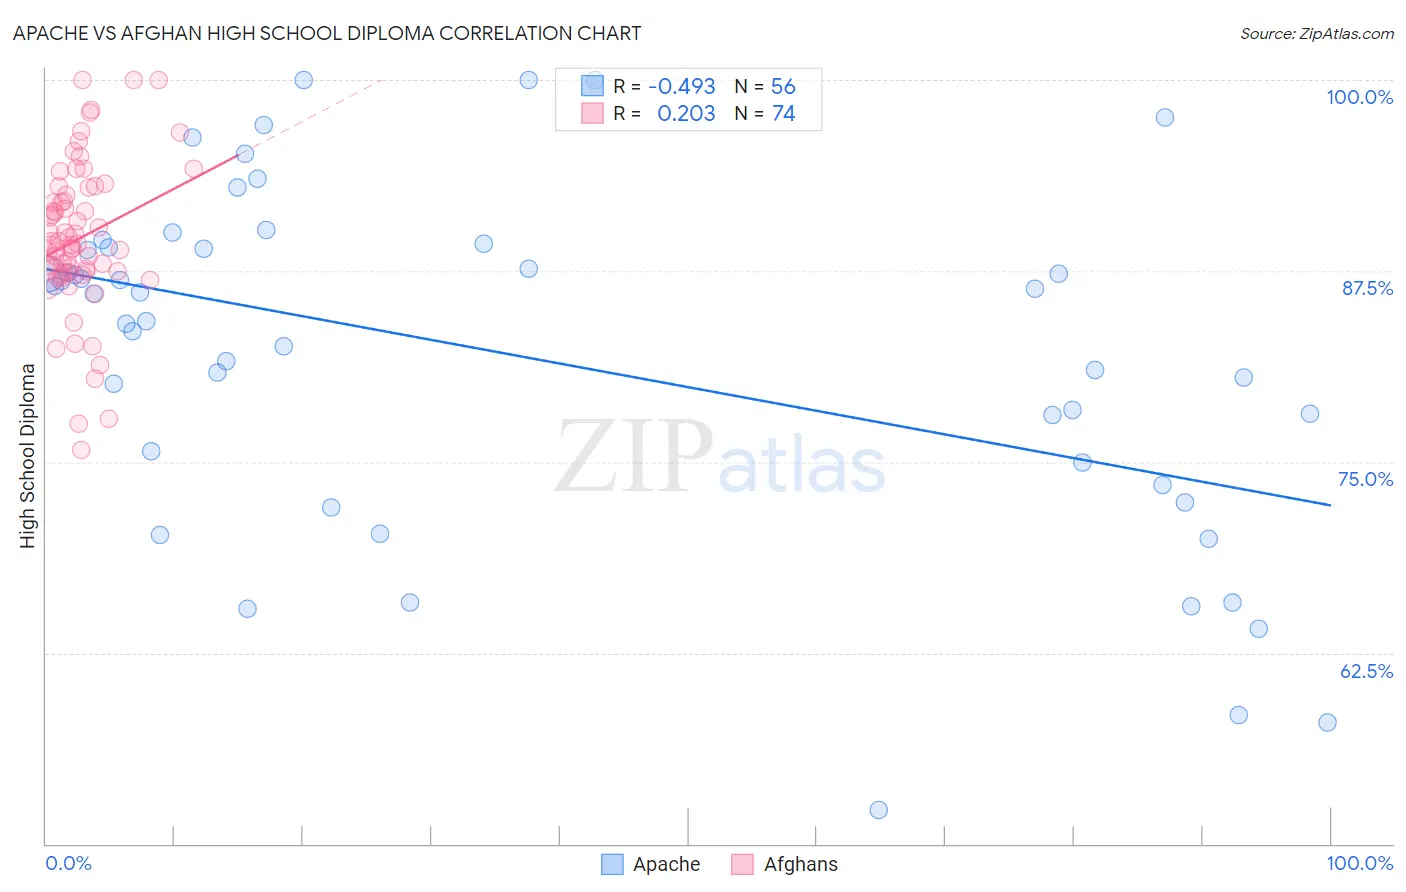
Apache vs Afghan High School Diploma Correlation Chart
The statistical analysis conducted on geographies consisting of 231,143,094 people shows a moderate negative correlation between the proportion of Apache and percentage of population with at least high school diploma education in the United States with a correlation coefficient (R) of -0.493 and weighted average of 85.1%. Similarly, the statistical analysis conducted on geographies consisting of 148,851,685 people shows a weak positive correlation between the proportion of Afghans and percentage of population with at least high school diploma education in the United States with a correlation coefficient (R) of 0.203 and weighted average of 88.8%, a difference of 4.3%.
High School Diploma Correlation Summary
| Measurement | Apache | Afghan |
| Minimum | 52.2% | 75.7% |
| Maximum | 100.0% | 100.0% |
| Range | 47.8% | 24.3% |
| Mean | 81.9% | 89.6% |
| Median | 85.1% | 89.2% |
| Interquartile 25% (IQ1) | 74.2% | 87.4% |
| Interquartile 75% (IQ3) | 89.0% | 92.4% |
| Interquartile Range (IQR) | 14.8% | 5.0% |
| Standard Deviation (Sample) | 11.3% | 4.9% |
| Standard Deviation (Population) | 11.2% | 4.9% |
Similar Demographics by High School Diploma
Demographics Similar to Apache by High School Diploma
In terms of high school diploma, the demographic groups most similar to Apache are Ecuadorian (85.1%, a difference of 0.010%), Cape Verdean (85.1%, a difference of 0.060%), Immigrants from Dominica (85.2%, a difference of 0.080%), Immigrants from Armenia (85.2%, a difference of 0.090%), and Navajo (85.2%, a difference of 0.10%).
| Demographics | Rating | Rank | High School Diploma |
| Cubans | 0.0 /100 | #303 | Tragic 85.4% |
| Nepalese | 0.0 /100 | #304 | Tragic 85.3% |
| Immigrants | Portugal | 0.0 /100 | #305 | Tragic 85.3% |
| Immigrants | Guyana | 0.0 /100 | #306 | Tragic 85.3% |
| Navajo | 0.0 /100 | #307 | Tragic 85.2% |
| Immigrants | Armenia | 0.0 /100 | #308 | Tragic 85.2% |
| Immigrants | Dominica | 0.0 /100 | #309 | Tragic 85.2% |
| Apache | 0.0 /100 | #310 | Tragic 85.1% |
| Ecuadorians | 0.0 /100 | #311 | Tragic 85.1% |
| Cape Verdeans | 0.0 /100 | #312 | Tragic 85.1% |
| Immigrants | Ecuador | 0.0 /100 | #313 | Tragic 84.8% |
| Yaqui | 0.0 /100 | #314 | Tragic 84.7% |
| Puerto Ricans | 0.0 /100 | #315 | Tragic 84.7% |
| Belizeans | 0.0 /100 | #316 | Tragic 84.3% |
| Immigrants | Caribbean | 0.0 /100 | #317 | Tragic 84.3% |
Demographics Similar to Afghans by High School Diploma
In terms of high school diploma, the demographic groups most similar to Afghans are Immigrants from Southern Europe (88.7%, a difference of 0.010%), Immigrants from Venezuela (88.8%, a difference of 0.040%), French American Indian (88.7%, a difference of 0.050%), Immigrants from Oceania (88.8%, a difference of 0.060%), and Moroccan (88.8%, a difference of 0.11%).
| Demographics | Rating | Rank | High School Diploma |
| Immigrants | Sudan | 33.4 /100 | #188 | Fair 88.9% |
| Immigrants | Uganda | 32.6 /100 | #189 | Fair 88.9% |
| Immigrants | Chile | 31.9 /100 | #190 | Fair 88.9% |
| Immigrants | Ethiopia | 30.9 /100 | #191 | Fair 88.9% |
| Moroccans | 29.5 /100 | #192 | Fair 88.8% |
| Immigrants | Oceania | 26.9 /100 | #193 | Fair 88.8% |
| Immigrants | Venezuela | 25.8 /100 | #194 | Fair 88.8% |
| Afghans | 23.9 /100 | #195 | Fair 88.8% |
| Immigrants | Southern Europe | 23.4 /100 | #196 | Fair 88.7% |
| French American Indians | 21.5 /100 | #197 | Fair 88.7% |
| Liberians | 18.8 /100 | #198 | Poor 88.7% |
| Marshallese | 18.7 /100 | #199 | Poor 88.6% |
| Hawaiians | 18.3 /100 | #200 | Poor 88.6% |
| Koreans | 18.1 /100 | #201 | Poor 88.6% |
| Panamanians | 18.0 /100 | #202 | Poor 88.6% |