Apache vs Immigrants from Jamaica High School Diploma
COMPARE
Apache
Immigrants from Jamaica
High School Diploma
High School Diploma Comparison
Apache
Immigrants from Jamaica
85.1%
HIGH SCHOOL DIPLOMA
0.0/ 100
METRIC RATING
310th/ 347
METRIC RANK
86.9%
HIGH SCHOOL DIPLOMA
0.1/ 100
METRIC RATING
273rd/ 347
METRIC RANK
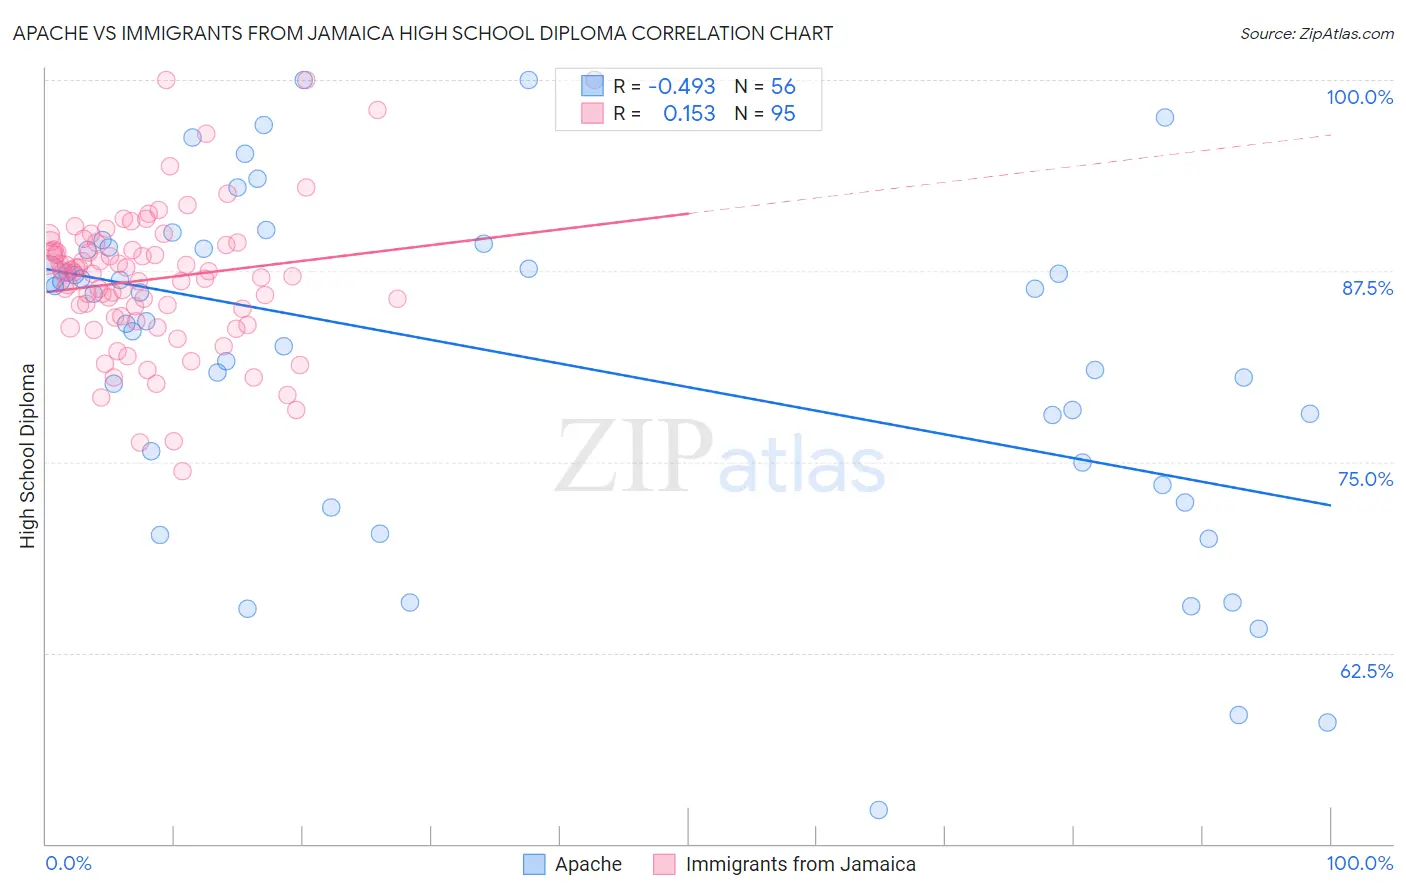
Apache vs Immigrants from Jamaica High School Diploma Correlation Chart
The statistical analysis conducted on geographies consisting of 231,143,094 people shows a moderate negative correlation between the proportion of Apache and percentage of population with at least high school diploma education in the United States with a correlation coefficient (R) of -0.493 and weighted average of 85.1%. Similarly, the statistical analysis conducted on geographies consisting of 301,829,550 people shows a poor positive correlation between the proportion of Immigrants from Jamaica and percentage of population with at least high school diploma education in the United States with a correlation coefficient (R) of 0.153 and weighted average of 86.9%, a difference of 2.1%.
High School Diploma Correlation Summary
| Measurement | Apache | Immigrants from Jamaica |
| Minimum | 52.2% | 74.4% |
| Maximum | 100.0% | 100.0% |
| Range | 47.8% | 25.6% |
| Mean | 81.9% | 87.0% |
| Median | 85.1% | 87.4% |
| Interquartile 25% (IQ1) | 74.2% | 84.5% |
| Interquartile 75% (IQ3) | 89.0% | 89.2% |
| Interquartile Range (IQR) | 14.8% | 4.7% |
| Standard Deviation (Sample) | 11.3% | 4.7% |
| Standard Deviation (Population) | 11.2% | 4.7% |
Similar Demographics by High School Diploma
Demographics Similar to Apache by High School Diploma
In terms of high school diploma, the demographic groups most similar to Apache are Ecuadorian (85.1%, a difference of 0.010%), Cape Verdean (85.1%, a difference of 0.060%), Immigrants from Dominica (85.2%, a difference of 0.080%), Immigrants from Armenia (85.2%, a difference of 0.090%), and Navajo (85.2%, a difference of 0.10%).
| Demographics | Rating | Rank | High School Diploma |
| Cubans | 0.0 /100 | #303 | Tragic 85.4% |
| Nepalese | 0.0 /100 | #304 | Tragic 85.3% |
| Immigrants | Portugal | 0.0 /100 | #305 | Tragic 85.3% |
| Immigrants | Guyana | 0.0 /100 | #306 | Tragic 85.3% |
| Navajo | 0.0 /100 | #307 | Tragic 85.2% |
| Immigrants | Armenia | 0.0 /100 | #308 | Tragic 85.2% |
| Immigrants | Dominica | 0.0 /100 | #309 | Tragic 85.2% |
| Apache | 0.0 /100 | #310 | Tragic 85.1% |
| Ecuadorians | 0.0 /100 | #311 | Tragic 85.1% |
| Cape Verdeans | 0.0 /100 | #312 | Tragic 85.1% |
| Immigrants | Ecuador | 0.0 /100 | #313 | Tragic 84.8% |
| Yaqui | 0.0 /100 | #314 | Tragic 84.7% |
| Puerto Ricans | 0.0 /100 | #315 | Tragic 84.7% |
| Belizeans | 0.0 /100 | #316 | Tragic 84.3% |
| Immigrants | Caribbean | 0.0 /100 | #317 | Tragic 84.3% |
Demographics Similar to Immigrants from Jamaica by High School Diploma
In terms of high school diploma, the demographic groups most similar to Immigrants from Jamaica are Bangladeshi (86.9%, a difference of 0.010%), Trinidadian and Tobagonian (86.9%, a difference of 0.030%), West Indian (86.9%, a difference of 0.040%), Malaysian (87.0%, a difference of 0.11%), and Sri Lankan (87.0%, a difference of 0.12%).
| Demographics | Rating | Rank | High School Diploma |
| Immigrants | Congo | 0.2 /100 | #266 | Tragic 87.0% |
| Blacks/African Americans | 0.2 /100 | #267 | Tragic 87.0% |
| Pennsylvania Germans | 0.2 /100 | #268 | Tragic 87.0% |
| Sri Lankans | 0.2 /100 | #269 | Tragic 87.0% |
| Malaysians | 0.2 /100 | #270 | Tragic 87.0% |
| West Indians | 0.1 /100 | #271 | Tragic 86.9% |
| Trinidadians and Tobagonians | 0.1 /100 | #272 | Tragic 86.9% |
| Immigrants | Jamaica | 0.1 /100 | #273 | Tragic 86.9% |
| Bangladeshis | 0.1 /100 | #274 | Tragic 86.9% |
| Immigrants | Trinidad and Tobago | 0.1 /100 | #275 | Tragic 86.8% |
| Immigrants | Burma/Myanmar | 0.1 /100 | #276 | Tragic 86.7% |
| Barbadians | 0.1 /100 | #277 | Tragic 86.7% |
| Hopi | 0.1 /100 | #278 | Tragic 86.6% |
| Immigrants | Laos | 0.0 /100 | #279 | Tragic 86.6% |
| Pueblo | 0.0 /100 | #280 | Tragic 86.5% |