Apache vs Romanian High School Diploma
COMPARE
Apache
Romanian
High School Diploma
High School Diploma Comparison
Apache
Romanians
85.1%
HIGH SCHOOL DIPLOMA
0.0/ 100
METRIC RATING
310th/ 347
METRIC RANK
90.7%
HIGH SCHOOL DIPLOMA
98.9/ 100
METRIC RATING
85th/ 347
METRIC RANK
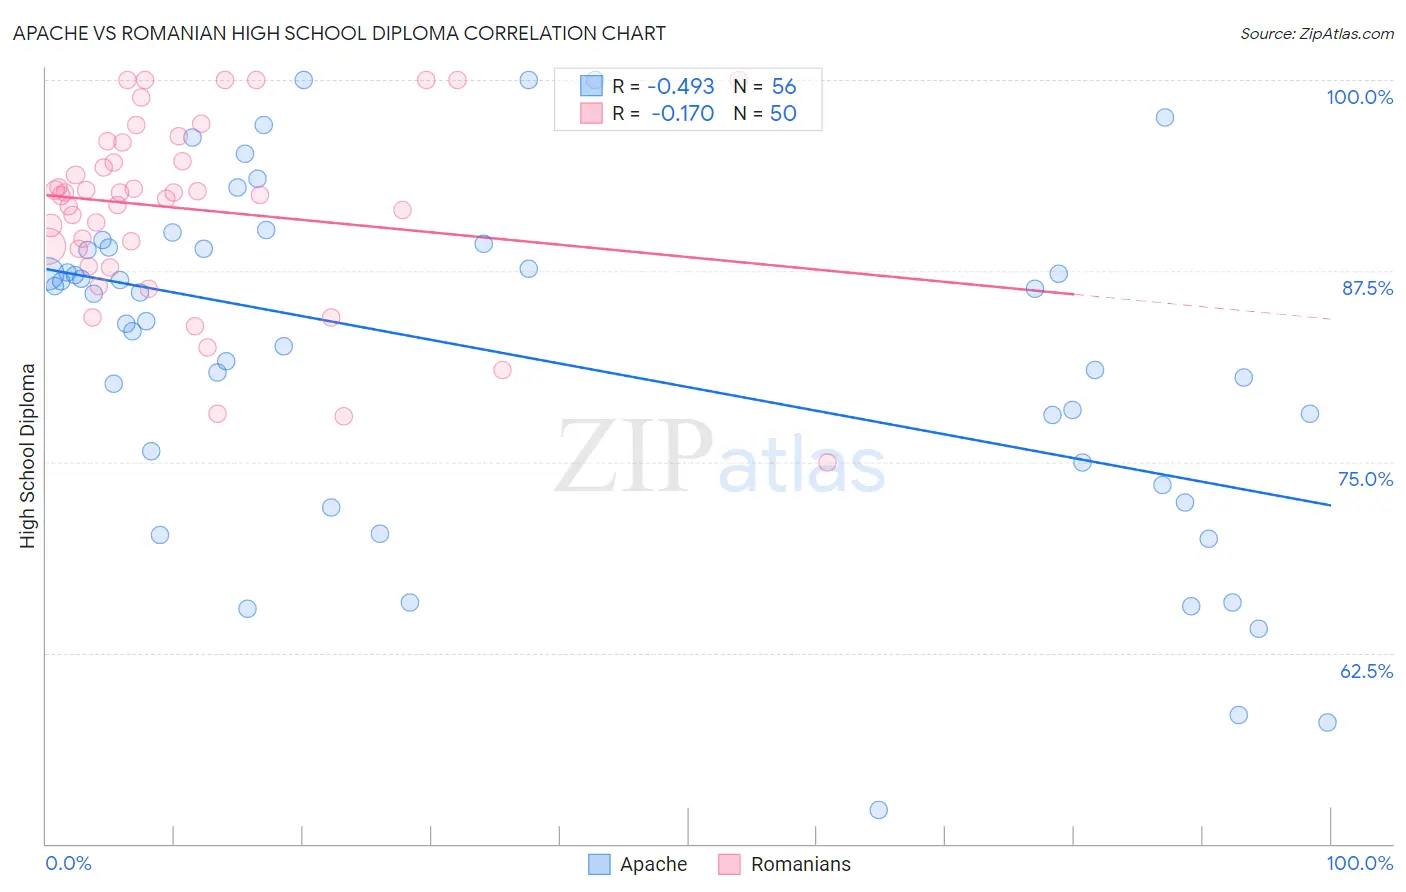
Apache vs Romanian High School Diploma Correlation Chart
The statistical analysis conducted on geographies consisting of 231,143,094 people shows a moderate negative correlation between the proportion of Apache and percentage of population with at least high school diploma education in the United States with a correlation coefficient (R) of -0.493 and weighted average of 85.1%. Similarly, the statistical analysis conducted on geographies consisting of 377,905,122 people shows a poor negative correlation between the proportion of Romanians and percentage of population with at least high school diploma education in the United States with a correlation coefficient (R) of -0.170 and weighted average of 90.7%, a difference of 6.5%.
High School Diploma Correlation Summary
| Measurement | Apache | Romanian |
| Minimum | 52.2% | 75.0% |
| Maximum | 100.0% | 100.0% |
| Range | 47.8% | 25.0% |
| Mean | 81.9% | 91.6% |
| Median | 85.1% | 92.6% |
| Interquartile 25% (IQ1) | 74.2% | 89.0% |
| Interquartile 75% (IQ3) | 89.0% | 95.9% |
| Interquartile Range (IQR) | 14.8% | 7.0% |
| Standard Deviation (Sample) | 11.3% | 6.1% |
| Standard Deviation (Population) | 11.2% | 6.0% |
Similar Demographics by High School Diploma
Demographics Similar to Apache by High School Diploma
In terms of high school diploma, the demographic groups most similar to Apache are Ecuadorian (85.1%, a difference of 0.010%), Cape Verdean (85.1%, a difference of 0.060%), Immigrants from Dominica (85.2%, a difference of 0.080%), Immigrants from Armenia (85.2%, a difference of 0.090%), and Navajo (85.2%, a difference of 0.10%).
| Demographics | Rating | Rank | High School Diploma |
| Cubans | 0.0 /100 | #303 | Tragic 85.4% |
| Nepalese | 0.0 /100 | #304 | Tragic 85.3% |
| Immigrants | Portugal | 0.0 /100 | #305 | Tragic 85.3% |
| Immigrants | Guyana | 0.0 /100 | #306 | Tragic 85.3% |
| Navajo | 0.0 /100 | #307 | Tragic 85.2% |
| Immigrants | Armenia | 0.0 /100 | #308 | Tragic 85.2% |
| Immigrants | Dominica | 0.0 /100 | #309 | Tragic 85.2% |
| Apache | 0.0 /100 | #310 | Tragic 85.1% |
| Ecuadorians | 0.0 /100 | #311 | Tragic 85.1% |
| Cape Verdeans | 0.0 /100 | #312 | Tragic 85.1% |
| Immigrants | Ecuador | 0.0 /100 | #313 | Tragic 84.8% |
| Yaqui | 0.0 /100 | #314 | Tragic 84.7% |
| Puerto Ricans | 0.0 /100 | #315 | Tragic 84.7% |
| Belizeans | 0.0 /100 | #316 | Tragic 84.3% |
| Immigrants | Caribbean | 0.0 /100 | #317 | Tragic 84.3% |
Demographics Similar to Romanians by High School Diploma
In terms of high school diploma, the demographic groups most similar to Romanians are Immigrants from Bulgaria (90.6%, a difference of 0.010%), Immigrants from Turkey (90.6%, a difference of 0.010%), Immigrants from France (90.6%, a difference of 0.030%), Canadian (90.6%, a difference of 0.050%), and Celtic (90.6%, a difference of 0.060%).
| Demographics | Rating | Rank | High School Diploma |
| Burmese | 99.3 /100 | #78 | Exceptional 90.8% |
| Immigrants | Denmark | 99.3 /100 | #79 | Exceptional 90.8% |
| Immigrants | England | 99.3 /100 | #80 | Exceptional 90.8% |
| Immigrants | Switzerland | 99.3 /100 | #81 | Exceptional 90.8% |
| Scotch-Irish | 99.2 /100 | #82 | Exceptional 90.8% |
| Immigrants | Moldova | 99.2 /100 | #83 | Exceptional 90.7% |
| Immigrants | Saudi Arabia | 99.1 /100 | #84 | Exceptional 90.7% |
| Romanians | 98.9 /100 | #85 | Exceptional 90.7% |
| Immigrants | Bulgaria | 98.9 /100 | #86 | Exceptional 90.6% |
| Immigrants | Turkey | 98.9 /100 | #87 | Exceptional 90.6% |
| Immigrants | France | 98.8 /100 | #88 | Exceptional 90.6% |
| Canadians | 98.7 /100 | #89 | Exceptional 90.6% |
| Celtics | 98.7 /100 | #90 | Exceptional 90.6% |
| South Africans | 98.6 /100 | #91 | Exceptional 90.6% |
| Swiss | 98.6 /100 | #92 | Exceptional 90.6% |