Apache vs Immigrants from Guatemala High School Diploma
COMPARE
Apache
Immigrants from Guatemala
High School Diploma
High School Diploma Comparison
Apache
Immigrants from Guatemala
85.1%
HIGH SCHOOL DIPLOMA
0.0/ 100
METRIC RATING
310th/ 347
METRIC RANK
81.4%
HIGH SCHOOL DIPLOMA
0.0/ 100
METRIC RATING
342nd/ 347
METRIC RANK
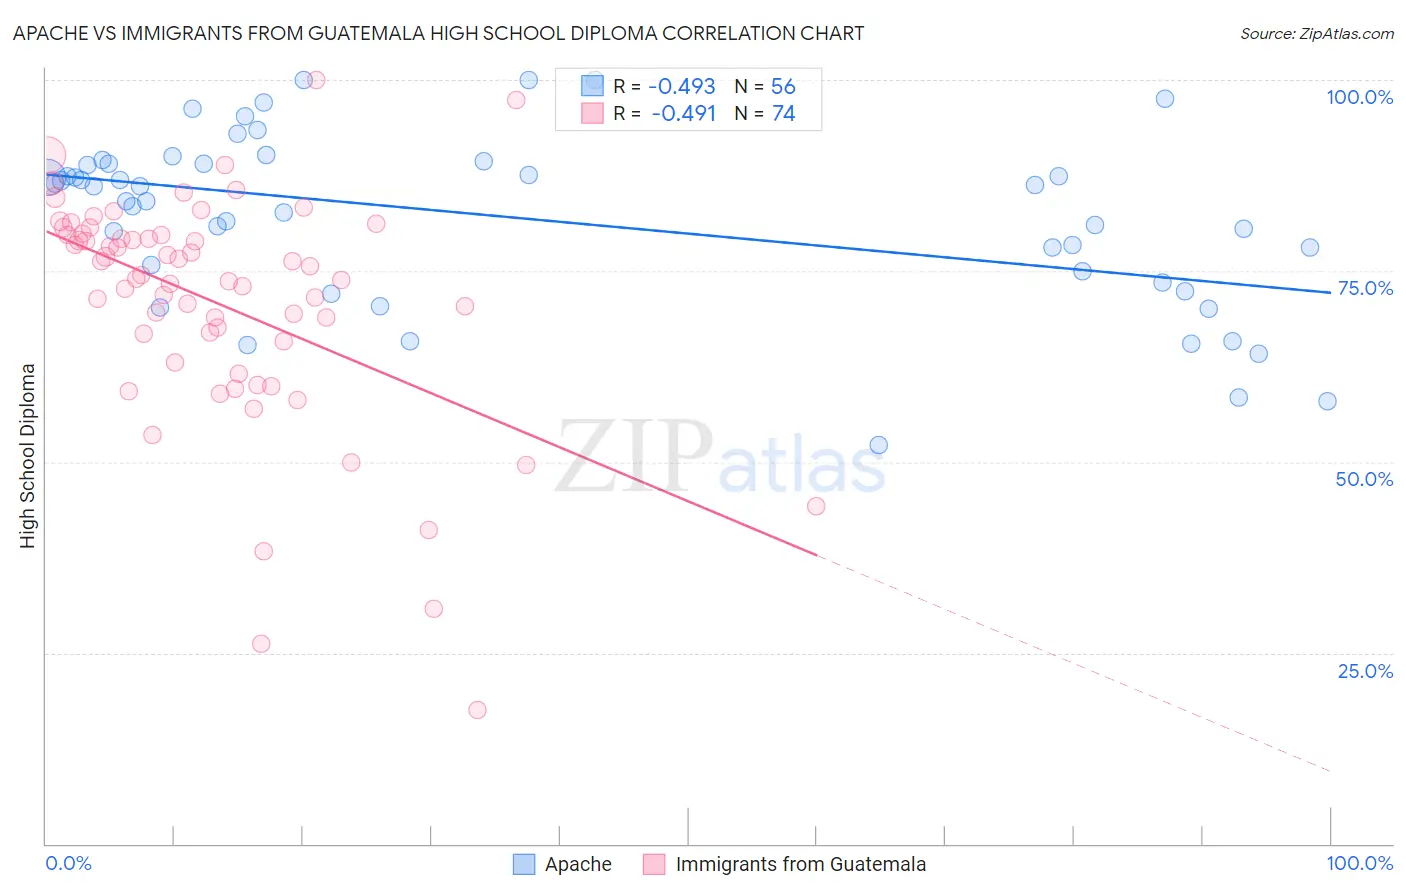
Apache vs Immigrants from Guatemala High School Diploma Correlation Chart
The statistical analysis conducted on geographies consisting of 231,143,094 people shows a moderate negative correlation between the proportion of Apache and percentage of population with at least high school diploma education in the United States with a correlation coefficient (R) of -0.493 and weighted average of 85.1%. Similarly, the statistical analysis conducted on geographies consisting of 377,286,142 people shows a moderate negative correlation between the proportion of Immigrants from Guatemala and percentage of population with at least high school diploma education in the United States with a correlation coefficient (R) of -0.491 and weighted average of 81.4%, a difference of 4.6%.
High School Diploma Correlation Summary
| Measurement | Apache | Immigrants from Guatemala |
| Minimum | 52.2% | 17.4% |
| Maximum | 100.0% | 100.0% |
| Range | 47.8% | 82.6% |
| Mean | 81.9% | 70.8% |
| Median | 85.1% | 74.3% |
| Interquartile 25% (IQ1) | 74.2% | 65.9% |
| Interquartile 75% (IQ3) | 89.0% | 79.8% |
| Interquartile Range (IQR) | 14.8% | 13.9% |
| Standard Deviation (Sample) | 11.3% | 15.2% |
| Standard Deviation (Population) | 11.2% | 15.1% |
Similar Demographics by High School Diploma
Demographics Similar to Apache by High School Diploma
In terms of high school diploma, the demographic groups most similar to Apache are Ecuadorian (85.1%, a difference of 0.010%), Cape Verdean (85.1%, a difference of 0.060%), Immigrants from Dominica (85.2%, a difference of 0.080%), Immigrants from Armenia (85.2%, a difference of 0.090%), and Navajo (85.2%, a difference of 0.10%).
| Demographics | Rating | Rank | High School Diploma |
| Cubans | 0.0 /100 | #303 | Tragic 85.4% |
| Nepalese | 0.0 /100 | #304 | Tragic 85.3% |
| Immigrants | Portugal | 0.0 /100 | #305 | Tragic 85.3% |
| Immigrants | Guyana | 0.0 /100 | #306 | Tragic 85.3% |
| Navajo | 0.0 /100 | #307 | Tragic 85.2% |
| Immigrants | Armenia | 0.0 /100 | #308 | Tragic 85.2% |
| Immigrants | Dominica | 0.0 /100 | #309 | Tragic 85.2% |
| Apache | 0.0 /100 | #310 | Tragic 85.1% |
| Ecuadorians | 0.0 /100 | #311 | Tragic 85.1% |
| Cape Verdeans | 0.0 /100 | #312 | Tragic 85.1% |
| Immigrants | Ecuador | 0.0 /100 | #313 | Tragic 84.8% |
| Yaqui | 0.0 /100 | #314 | Tragic 84.7% |
| Puerto Ricans | 0.0 /100 | #315 | Tragic 84.7% |
| Belizeans | 0.0 /100 | #316 | Tragic 84.3% |
| Immigrants | Caribbean | 0.0 /100 | #317 | Tragic 84.3% |
Demographics Similar to Immigrants from Guatemala by High School Diploma
In terms of high school diploma, the demographic groups most similar to Immigrants from Guatemala are Mexican (81.4%, a difference of 0.040%), Houma (81.5%, a difference of 0.20%), Pima (81.6%, a difference of 0.31%), Salvadoran (81.7%, a difference of 0.40%), and Immigrants from Yemen (81.8%, a difference of 0.58%).
| Demographics | Rating | Rank | High School Diploma |
| Immigrants | Latin America | 0.0 /100 | #333 | Tragic 82.1% |
| Tohono O'odham | 0.0 /100 | #334 | Tragic 82.1% |
| Guatemalans | 0.0 /100 | #335 | Tragic 82.0% |
| Immigrants | Dominican Republic | 0.0 /100 | #336 | Tragic 82.0% |
| Immigrants | Yemen | 0.0 /100 | #337 | Tragic 81.8% |
| Salvadorans | 0.0 /100 | #338 | Tragic 81.7% |
| Pima | 0.0 /100 | #339 | Tragic 81.6% |
| Houma | 0.0 /100 | #340 | Tragic 81.5% |
| Mexicans | 0.0 /100 | #341 | Tragic 81.4% |
| Immigrants | Guatemala | 0.0 /100 | #342 | Tragic 81.4% |
| Immigrants | El Salvador | 0.0 /100 | #343 | Tragic 80.8% |
| Immigrants | Central America | 0.0 /100 | #344 | Tragic 80.1% |
| Yakama | 0.0 /100 | #345 | Tragic 80.0% |
| Spanish American Indians | 0.0 /100 | #346 | Tragic 79.8% |
| Immigrants | Mexico | 0.0 /100 | #347 | Tragic 79.5% |