Estonian vs Immigrants from Zimbabwe High School Diploma
COMPARE
Estonian
Immigrants from Zimbabwe
High School Diploma
High School Diploma Comparison
Estonians
Immigrants from Zimbabwe
91.6%
HIGH SCHOOL DIPLOMA
99.9/ 100
METRIC RATING
22nd/ 347
METRIC RANK
90.3%
HIGH SCHOOL DIPLOMA
96.7/ 100
METRIC RATING
109th/ 347
METRIC RANK
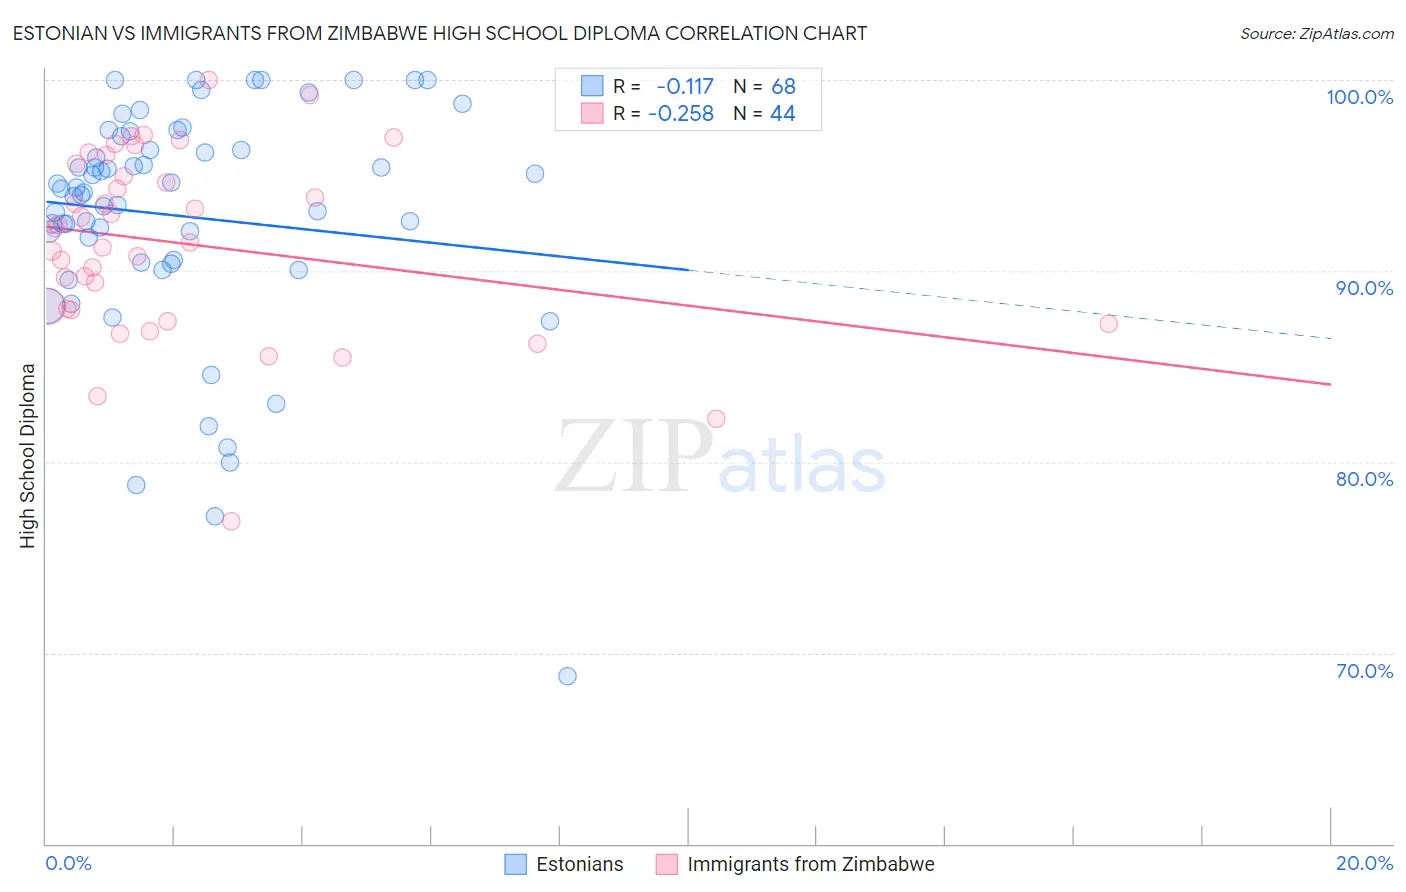
Estonian vs Immigrants from Zimbabwe High School Diploma Correlation Chart
The statistical analysis conducted on geographies consisting of 123,527,724 people shows a poor negative correlation between the proportion of Estonians and percentage of population with at least high school diploma education in the United States with a correlation coefficient (R) of -0.117 and weighted average of 91.6%. Similarly, the statistical analysis conducted on geographies consisting of 117,809,864 people shows a weak negative correlation between the proportion of Immigrants from Zimbabwe and percentage of population with at least high school diploma education in the United States with a correlation coefficient (R) of -0.258 and weighted average of 90.3%, a difference of 1.4%.
High School Diploma Correlation Summary
| Measurement | Estonian | Immigrants from Zimbabwe |
| Minimum | 68.8% | 76.9% |
| Maximum | 100.0% | 100.0% |
| Range | 31.2% | 23.1% |
| Mean | 92.9% | 91.4% |
| Median | 94.2% | 91.9% |
| Interquartile 25% (IQ1) | 90.5% | 88.0% |
| Interquartile 75% (IQ3) | 96.7% | 95.3% |
| Interquartile Range (IQR) | 6.2% | 7.3% |
| Standard Deviation (Sample) | 6.1% | 4.8% |
| Standard Deviation (Population) | 6.1% | 4.8% |
Similar Demographics by High School Diploma
Demographics Similar to Estonians by High School Diploma
In terms of high school diploma, the demographic groups most similar to Estonians are Filipino (91.6%, a difference of 0.010%), Czech (91.6%, a difference of 0.020%), Scandinavian (91.5%, a difference of 0.030%), Italian (91.5%, a difference of 0.030%), and Thai (91.5%, a difference of 0.030%).
| Demographics | Rating | Rank | High School Diploma |
| Luxembourgers | 100.0 /100 | #15 | Exceptional 91.7% |
| Finns | 100.0 /100 | #16 | Exceptional 91.7% |
| Immigrants | Singapore | 99.9 /100 | #17 | Exceptional 91.7% |
| Germans | 99.9 /100 | #18 | Exceptional 91.7% |
| Maltese | 99.9 /100 | #19 | Exceptional 91.6% |
| Czechs | 99.9 /100 | #20 | Exceptional 91.6% |
| Filipinos | 99.9 /100 | #21 | Exceptional 91.6% |
| Estonians | 99.9 /100 | #22 | Exceptional 91.6% |
| Scandinavians | 99.9 /100 | #23 | Exceptional 91.5% |
| Italians | 99.9 /100 | #24 | Exceptional 91.5% |
| Thais | 99.9 /100 | #25 | Exceptional 91.5% |
| Russians | 99.9 /100 | #26 | Exceptional 91.5% |
| Cypriots | 99.9 /100 | #27 | Exceptional 91.5% |
| Tlingit-Haida | 99.9 /100 | #28 | Exceptional 91.4% |
| Europeans | 99.9 /100 | #29 | Exceptional 91.4% |
Demographics Similar to Immigrants from Zimbabwe by High School Diploma
In terms of high school diploma, the demographic groups most similar to Immigrants from Zimbabwe are Palestinian (90.3%, a difference of 0.0%), Immigrants from Greece (90.3%, a difference of 0.010%), Menominee (90.3%, a difference of 0.010%), Immigrants from Russia (90.3%, a difference of 0.020%), and Syrian (90.3%, a difference of 0.030%).
| Demographics | Rating | Rank | High School Diploma |
| Aleuts | 98.0 /100 | #102 | Exceptional 90.4% |
| Immigrants | Romania | 97.8 /100 | #103 | Exceptional 90.4% |
| Immigrants | Croatia | 97.8 /100 | #104 | Exceptional 90.4% |
| Lebanese | 97.4 /100 | #105 | Exceptional 90.4% |
| Syrians | 97.0 /100 | #106 | Exceptional 90.3% |
| Immigrants | Russia | 96.9 /100 | #107 | Exceptional 90.3% |
| Palestinians | 96.7 /100 | #108 | Exceptional 90.3% |
| Immigrants | Zimbabwe | 96.7 /100 | #109 | Exceptional 90.3% |
| Immigrants | Greece | 96.6 /100 | #110 | Exceptional 90.3% |
| Menominee | 96.6 /100 | #111 | Exceptional 90.3% |
| Immigrants | Belarus | 96.4 /100 | #112 | Exceptional 90.2% |
| Immigrants | Sri Lanka | 96.3 /100 | #113 | Exceptional 90.2% |
| Yugoslavians | 96.2 /100 | #114 | Exceptional 90.2% |
| Immigrants | Hungary | 95.8 /100 | #115 | Exceptional 90.2% |
| Immigrants | Germany | 95.7 /100 | #116 | Exceptional 90.2% |