Apache vs Afghan GED/Equivalency
COMPARE
Apache
Afghan
GED/Equivalency
GED/Equivalency Comparison
Apache
Afghans
80.7%
GED/EQUIVALENCY
0.0/ 100
METRIC RATING
315th/ 347
METRIC RANK
85.9%
GED/EQUIVALENCY
59.7/ 100
METRIC RATING
170th/ 347
METRIC RANK
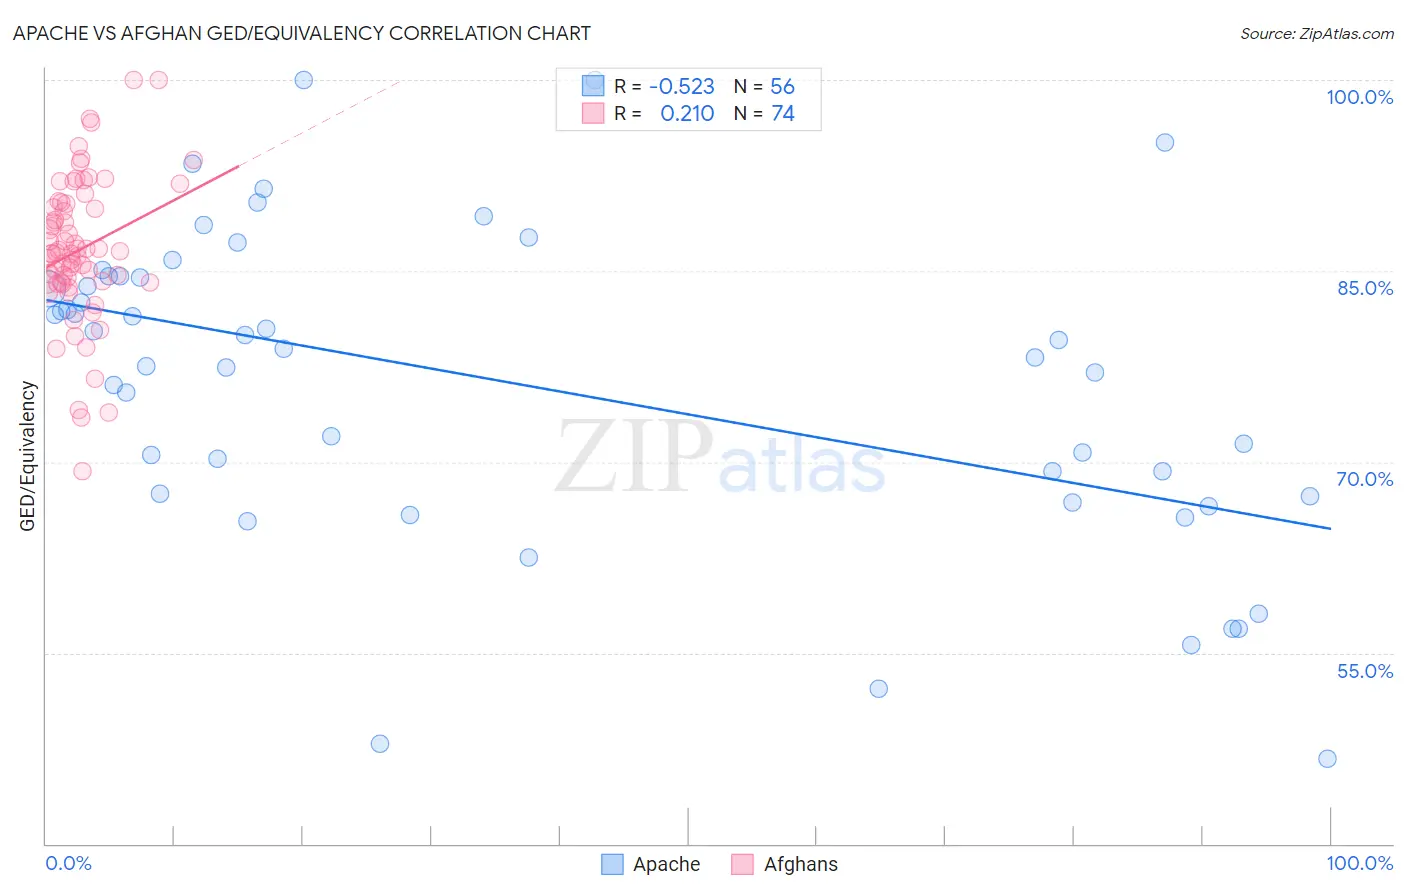
Apache vs Afghan GED/Equivalency Correlation Chart
The statistical analysis conducted on geographies consisting of 231,143,029 people shows a substantial negative correlation between the proportion of Apache and percentage of population with at least ged/equivalency education in the United States with a correlation coefficient (R) of -0.523 and weighted average of 80.7%. Similarly, the statistical analysis conducted on geographies consisting of 148,851,685 people shows a weak positive correlation between the proportion of Afghans and percentage of population with at least ged/equivalency education in the United States with a correlation coefficient (R) of 0.210 and weighted average of 85.9%, a difference of 6.5%.
GED/Equivalency Correlation Summary
| Measurement | Apache | Afghan |
| Minimum | 46.7% | 69.2% |
| Maximum | 100.0% | 100.0% |
| Range | 53.3% | 30.8% |
| Mean | 76.1% | 86.7% |
| Median | 78.5% | 86.4% |
| Interquartile 25% (IQ1) | 67.4% | 84.1% |
| Interquartile 75% (IQ3) | 84.5% | 90.3% |
| Interquartile Range (IQR) | 17.1% | 6.1% |
| Standard Deviation (Sample) | 12.4% | 5.7% |
| Standard Deviation (Population) | 12.2% | 5.7% |
Similar Demographics by GED/Equivalency
Demographics Similar to Apache by GED/Equivalency
In terms of ged/equivalency, the demographic groups most similar to Apache are Central American Indian (80.6%, a difference of 0.13%), Immigrants from Caribbean (80.5%, a difference of 0.24%), Belizean (80.9%, a difference of 0.25%), Yaqui (80.5%, a difference of 0.26%), and Immigrants from Belize (80.5%, a difference of 0.26%).
| Demographics | Rating | Rank | GED/Equivalency |
| Puerto Ricans | 0.0 /100 | #308 | Tragic 81.1% |
| Immigrants | Ecuador | 0.0 /100 | #309 | Tragic 81.0% |
| Immigrants | Guyana | 0.0 /100 | #310 | Tragic 81.0% |
| Natives/Alaskans | 0.0 /100 | #311 | Tragic 80.9% |
| Nicaraguans | 0.0 /100 | #312 | Tragic 80.9% |
| Cape Verdeans | 0.0 /100 | #313 | Tragic 80.9% |
| Belizeans | 0.0 /100 | #314 | Tragic 80.9% |
| Apache | 0.0 /100 | #315 | Tragic 80.7% |
| Central American Indians | 0.0 /100 | #316 | Tragic 80.6% |
| Immigrants | Caribbean | 0.0 /100 | #317 | Tragic 80.5% |
| Yaqui | 0.0 /100 | #318 | Tragic 80.5% |
| Immigrants | Belize | 0.0 /100 | #319 | Tragic 80.5% |
| Immigrants | Cuba | 0.0 /100 | #320 | Tragic 80.2% |
| Yup'ik | 0.0 /100 | #321 | Tragic 80.0% |
| Lumbee | 0.0 /100 | #322 | Tragic 80.0% |
Demographics Similar to Afghans by GED/Equivalency
In terms of ged/equivalency, the demographic groups most similar to Afghans are Immigrants from Ethiopia (86.0%, a difference of 0.030%), Sierra Leonean (86.0%, a difference of 0.050%), Immigrants from Chile (85.9%, a difference of 0.050%), Ethiopian (86.0%, a difference of 0.090%), and Alsatian (86.0%, a difference of 0.10%).
| Demographics | Rating | Rank | GED/Equivalency |
| Ugandans | 66.3 /100 | #163 | Good 86.1% |
| Venezuelans | 65.5 /100 | #164 | Good 86.0% |
| Alsatians | 64.3 /100 | #165 | Good 86.0% |
| Immigrants | Albania | 64.2 /100 | #166 | Good 86.0% |
| Ethiopians | 63.7 /100 | #167 | Good 86.0% |
| Sierra Leoneans | 61.8 /100 | #168 | Good 86.0% |
| Immigrants | Ethiopia | 61.2 /100 | #169 | Good 86.0% |
| Afghans | 59.7 /100 | #170 | Average 85.9% |
| Immigrants | Chile | 57.3 /100 | #171 | Average 85.9% |
| Bermudans | 55.1 /100 | #172 | Average 85.8% |
| Immigrants | Venezuela | 50.7 /100 | #173 | Average 85.8% |
| Ottawa | 50.0 /100 | #174 | Average 85.8% |
| Immigrants | Bolivia | 49.8 /100 | #175 | Average 85.8% |
| Immigrants | Eastern Africa | 47.7 /100 | #176 | Average 85.7% |
| Immigrants | Uganda | 45.2 /100 | #177 | Average 85.7% |