Apache vs Bhutanese GED/Equivalency
COMPARE
Apache
Bhutanese
GED/Equivalency
GED/Equivalency Comparison
Apache
Bhutanese
80.7%
GED/EQUIVALENCY
0.0/ 100
METRIC RATING
315th/ 347
METRIC RANK
88.4%
GED/EQUIVALENCY
99.8/ 100
METRIC RATING
31st/ 347
METRIC RANK
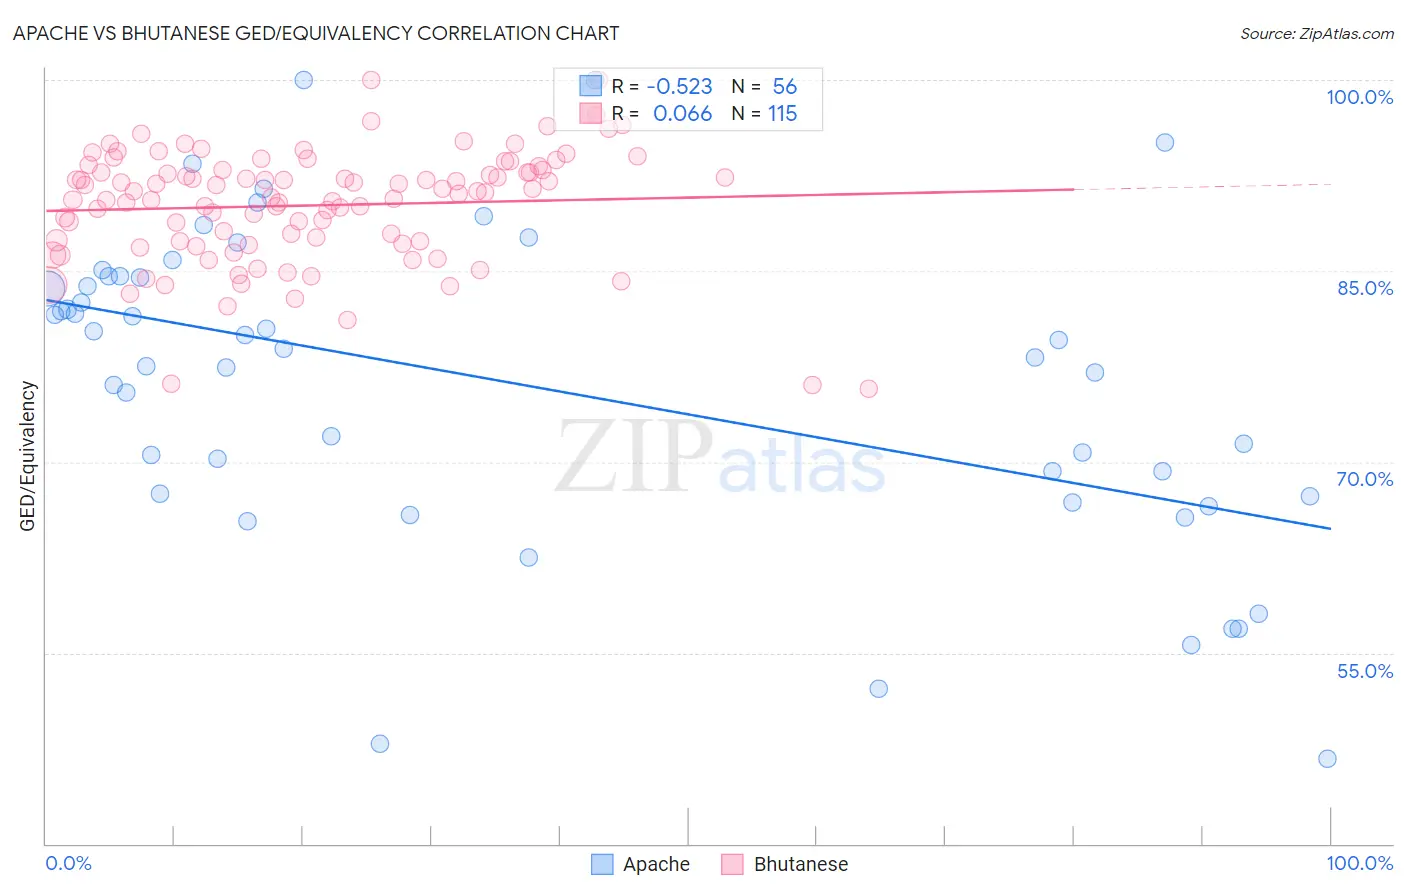
Apache vs Bhutanese GED/Equivalency Correlation Chart
The statistical analysis conducted on geographies consisting of 231,143,029 people shows a substantial negative correlation between the proportion of Apache and percentage of population with at least ged/equivalency education in the United States with a correlation coefficient (R) of -0.523 and weighted average of 80.7%. Similarly, the statistical analysis conducted on geographies consisting of 455,590,907 people shows a slight positive correlation between the proportion of Bhutanese and percentage of population with at least ged/equivalency education in the United States with a correlation coefficient (R) of 0.066 and weighted average of 88.4%, a difference of 9.6%.
GED/Equivalency Correlation Summary
| Measurement | Apache | Bhutanese |
| Minimum | 46.7% | 75.7% |
| Maximum | 100.0% | 100.0% |
| Range | 53.3% | 24.3% |
| Mean | 76.1% | 90.2% |
| Median | 78.5% | 91.1% |
| Interquartile 25% (IQ1) | 67.4% | 87.3% |
| Interquartile 75% (IQ3) | 84.5% | 92.9% |
| Interquartile Range (IQR) | 17.1% | 5.6% |
| Standard Deviation (Sample) | 12.4% | 4.5% |
| Standard Deviation (Population) | 12.2% | 4.5% |
Similar Demographics by GED/Equivalency
Demographics Similar to Apache by GED/Equivalency
In terms of ged/equivalency, the demographic groups most similar to Apache are Central American Indian (80.6%, a difference of 0.13%), Immigrants from Caribbean (80.5%, a difference of 0.24%), Belizean (80.9%, a difference of 0.25%), Yaqui (80.5%, a difference of 0.26%), and Immigrants from Belize (80.5%, a difference of 0.26%).
| Demographics | Rating | Rank | GED/Equivalency |
| Puerto Ricans | 0.0 /100 | #308 | Tragic 81.1% |
| Immigrants | Ecuador | 0.0 /100 | #309 | Tragic 81.0% |
| Immigrants | Guyana | 0.0 /100 | #310 | Tragic 81.0% |
| Natives/Alaskans | 0.0 /100 | #311 | Tragic 80.9% |
| Nicaraguans | 0.0 /100 | #312 | Tragic 80.9% |
| Cape Verdeans | 0.0 /100 | #313 | Tragic 80.9% |
| Belizeans | 0.0 /100 | #314 | Tragic 80.9% |
| Apache | 0.0 /100 | #315 | Tragic 80.7% |
| Central American Indians | 0.0 /100 | #316 | Tragic 80.6% |
| Immigrants | Caribbean | 0.0 /100 | #317 | Tragic 80.5% |
| Yaqui | 0.0 /100 | #318 | Tragic 80.5% |
| Immigrants | Belize | 0.0 /100 | #319 | Tragic 80.5% |
| Immigrants | Cuba | 0.0 /100 | #320 | Tragic 80.2% |
| Yup'ik | 0.0 /100 | #321 | Tragic 80.0% |
| Lumbee | 0.0 /100 | #322 | Tragic 80.0% |
Demographics Similar to Bhutanese by GED/Equivalency
In terms of ged/equivalency, the demographic groups most similar to Bhutanese are Danish (88.4%, a difference of 0.020%), Turkish (88.5%, a difference of 0.030%), Polish (88.5%, a difference of 0.050%), Immigrants from Sweden (88.4%, a difference of 0.060%), and Immigrants from Japan (88.4%, a difference of 0.070%).
| Demographics | Rating | Rank | GED/Equivalency |
| Slovaks | 99.8 /100 | #24 | Exceptional 88.6% |
| Estonians | 99.8 /100 | #25 | Exceptional 88.6% |
| Immigrants | Australia | 99.8 /100 | #26 | Exceptional 88.6% |
| Immigrants | Lithuania | 99.8 /100 | #27 | Exceptional 88.6% |
| Immigrants | Northern Europe | 99.8 /100 | #28 | Exceptional 88.5% |
| Poles | 99.8 /100 | #29 | Exceptional 88.5% |
| Turks | 99.8 /100 | #30 | Exceptional 88.5% |
| Bhutanese | 99.8 /100 | #31 | Exceptional 88.4% |
| Danes | 99.8 /100 | #32 | Exceptional 88.4% |
| Immigrants | Sweden | 99.7 /100 | #33 | Exceptional 88.4% |
| Immigrants | Japan | 99.7 /100 | #34 | Exceptional 88.4% |
| Immigrants | South Central Asia | 99.7 /100 | #35 | Exceptional 88.4% |
| Immigrants | Belgium | 99.7 /100 | #36 | Exceptional 88.3% |
| Immigrants | Austria | 99.7 /100 | #37 | Exceptional 88.3% |
| Burmese | 99.7 /100 | #38 | Exceptional 88.3% |