Albanian vs Immigrants from Syria GED/Equivalency
COMPARE
Albanian
Immigrants from Syria
GED/Equivalency
GED/Equivalency Comparison
Albanians
Immigrants from Syria
86.6%
GED/EQUIVALENCY
87.7/ 100
METRIC RATING
134th/ 347
METRIC RANK
86.1%
GED/EQUIVALENCY
69.3/ 100
METRIC RATING
161st/ 347
METRIC RANK
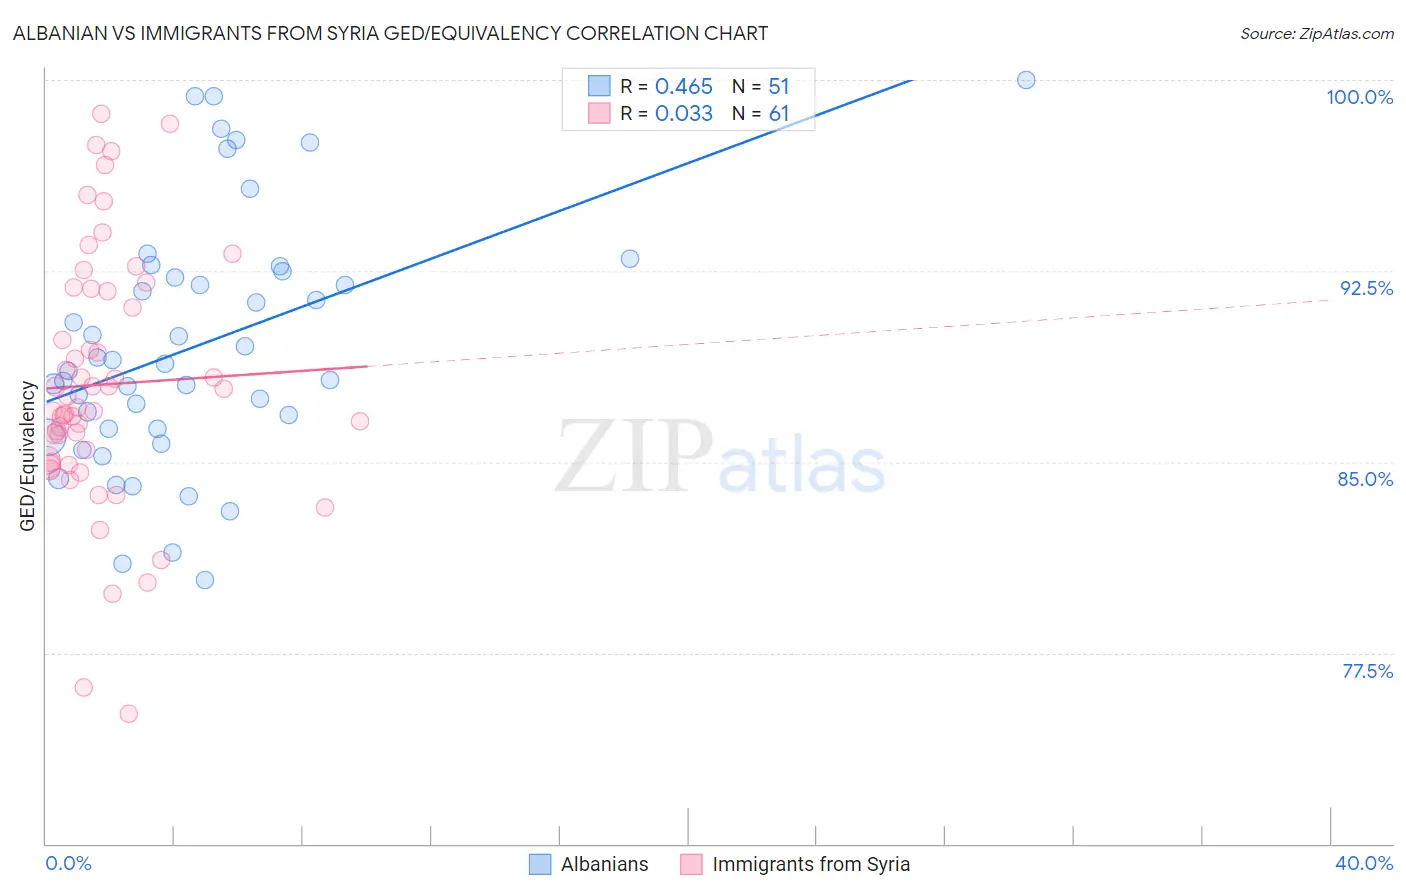
Albanian vs Immigrants from Syria GED/Equivalency Correlation Chart
The statistical analysis conducted on geographies consisting of 193,265,279 people shows a moderate positive correlation between the proportion of Albanians and percentage of population with at least ged/equivalency education in the United States with a correlation coefficient (R) of 0.465 and weighted average of 86.6%. Similarly, the statistical analysis conducted on geographies consisting of 174,108,882 people shows no correlation between the proportion of Immigrants from Syria and percentage of population with at least ged/equivalency education in the United States with a correlation coefficient (R) of 0.033 and weighted average of 86.1%, a difference of 0.59%.
GED/Equivalency Correlation Summary
| Measurement | Albanian | Immigrants from Syria |
| Minimum | 80.3% | 75.1% |
| Maximum | 100.0% | 98.7% |
| Range | 19.7% | 23.5% |
| Mean | 89.6% | 88.0% |
| Median | 88.9% | 87.1% |
| Interquartile 25% (IQ1) | 86.3% | 85.0% |
| Interquartile 75% (IQ3) | 92.5% | 91.8% |
| Interquartile Range (IQR) | 6.2% | 6.7% |
| Standard Deviation (Sample) | 4.9% | 5.0% |
| Standard Deviation (Population) | 4.8% | 4.9% |
Similar Demographics by GED/Equivalency
Demographics Similar to Albanians by GED/Equivalency
In terms of ged/equivalency, the demographic groups most similar to Albanians are Immigrants from Asia (86.6%, a difference of 0.010%), Immigrants from Brazil (86.6%, a difference of 0.030%), Tsimshian (86.6%, a difference of 0.030%), Immigrants from Spain (86.7%, a difference of 0.040%), and Chilean (86.6%, a difference of 0.040%).
| Demographics | Rating | Rank | GED/Equivalency |
| Argentineans | 89.7 /100 | #127 | Excellent 86.7% |
| Yugoslavians | 89.5 /100 | #128 | Excellent 86.7% |
| Immigrants | Ukraine | 88.9 /100 | #129 | Excellent 86.7% |
| Immigrants | Germany | 88.8 /100 | #130 | Excellent 86.7% |
| Immigrants | Spain | 88.5 /100 | #131 | Excellent 86.7% |
| Immigrants | Brazil | 88.4 /100 | #132 | Excellent 86.6% |
| Tsimshian | 88.3 /100 | #133 | Excellent 86.6% |
| Albanians | 87.7 /100 | #134 | Excellent 86.6% |
| Immigrants | Asia | 87.4 /100 | #135 | Excellent 86.6% |
| Chileans | 86.9 /100 | #136 | Excellent 86.6% |
| Arabs | 86.7 /100 | #137 | Excellent 86.6% |
| Immigrants | Argentina | 86.5 /100 | #138 | Excellent 86.6% |
| Immigrants | Malaysia | 85.0 /100 | #139 | Excellent 86.5% |
| Paraguayans | 84.1 /100 | #140 | Excellent 86.5% |
| Laotians | 83.2 /100 | #141 | Excellent 86.5% |
Demographics Similar to Immigrants from Syria by GED/Equivalency
In terms of ged/equivalency, the demographic groups most similar to Immigrants from Syria are Immigrants from Morocco (86.1%, a difference of 0.010%), Immigrants from Iraq (86.1%, a difference of 0.030%), Immigrants from Kenya (86.2%, a difference of 0.060%), White/Caucasian (86.2%, a difference of 0.070%), and German Russian (86.2%, a difference of 0.070%).
| Demographics | Rating | Rank | GED/Equivalency |
| Armenians | 76.4 /100 | #154 | Good 86.3% |
| Iraqis | 75.2 /100 | #155 | Good 86.2% |
| Immigrants | Nepal | 73.3 /100 | #156 | Good 86.2% |
| Whites/Caucasians | 72.2 /100 | #157 | Good 86.2% |
| German Russians | 72.1 /100 | #158 | Good 86.2% |
| Immigrants | Kenya | 71.8 /100 | #159 | Good 86.2% |
| Immigrants | Morocco | 69.5 /100 | #160 | Good 86.1% |
| Immigrants | Syria | 69.3 /100 | #161 | Good 86.1% |
| Immigrants | Iraq | 68.1 /100 | #162 | Good 86.1% |
| Ugandans | 66.3 /100 | #163 | Good 86.1% |
| Venezuelans | 65.5 /100 | #164 | Good 86.0% |
| Alsatians | 64.3 /100 | #165 | Good 86.0% |
| Immigrants | Albania | 64.2 /100 | #166 | Good 86.0% |
| Ethiopians | 63.7 /100 | #167 | Good 86.0% |
| Sierra Leoneans | 61.8 /100 | #168 | Good 86.0% |