Albanian vs Immigrants from the Azores GED/Equivalency
COMPARE
Albanian
Immigrants from the Azores
GED/Equivalency
GED/Equivalency Comparison
Albanians
Immigrants from the Azores
86.6%
GED/EQUIVALENCY
87.7/ 100
METRIC RATING
134th/ 347
METRIC RANK
78.7%
GED/EQUIVALENCY
0.0/ 100
METRIC RATING
332nd/ 347
METRIC RANK
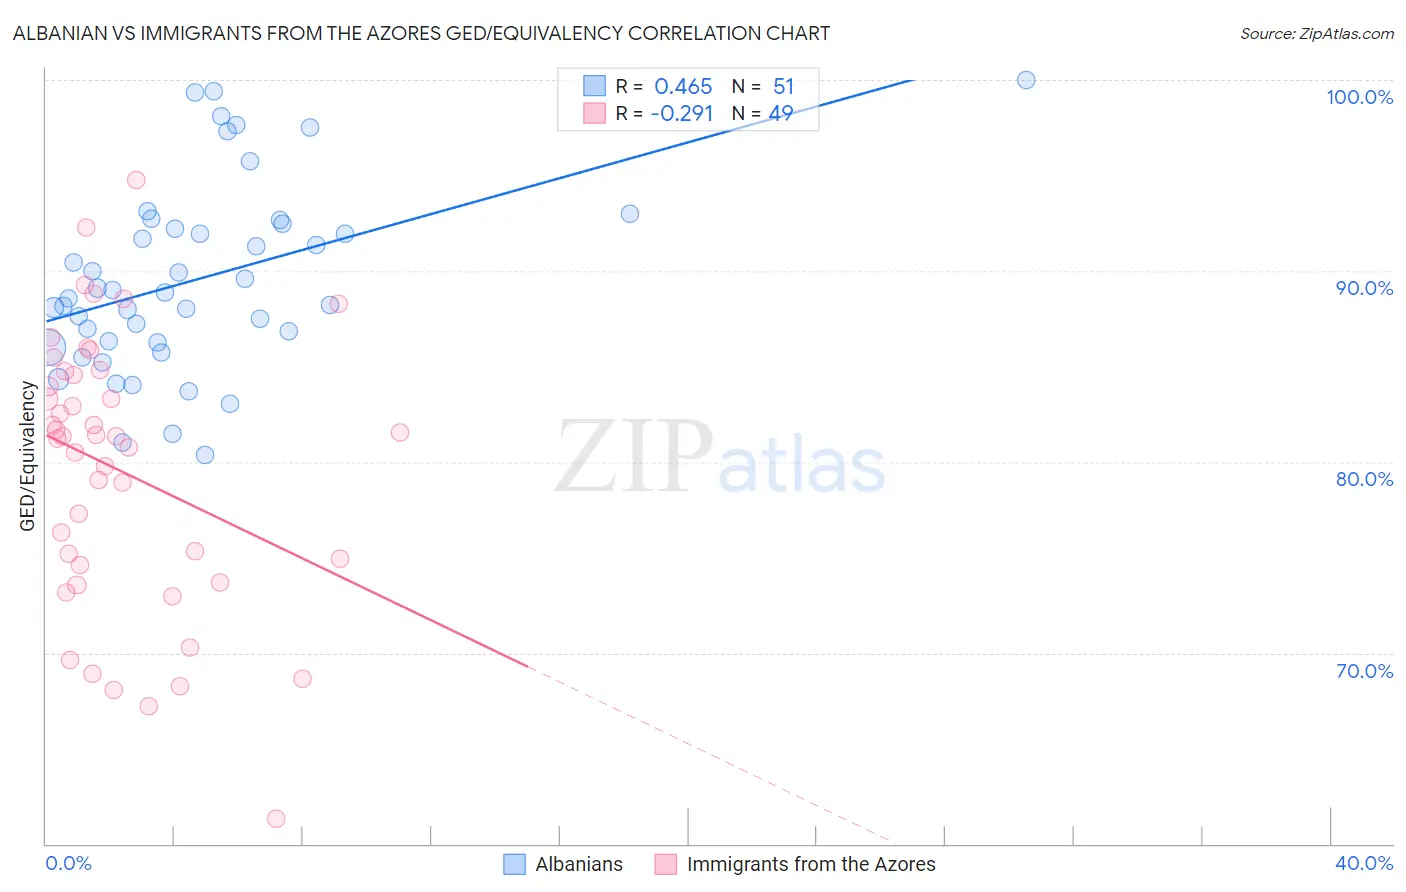
Albanian vs Immigrants from the Azores GED/Equivalency Correlation Chart
The statistical analysis conducted on geographies consisting of 193,265,279 people shows a moderate positive correlation between the proportion of Albanians and percentage of population with at least ged/equivalency education in the United States with a correlation coefficient (R) of 0.465 and weighted average of 86.6%. Similarly, the statistical analysis conducted on geographies consisting of 46,257,310 people shows a weak negative correlation between the proportion of Immigrants from the Azores and percentage of population with at least ged/equivalency education in the United States with a correlation coefficient (R) of -0.291 and weighted average of 78.7%, a difference of 10.1%.
GED/Equivalency Correlation Summary
| Measurement | Albanian | Immigrants from the Azores |
| Minimum | 80.3% | 61.3% |
| Maximum | 100.0% | 94.8% |
| Range | 19.7% | 33.5% |
| Mean | 89.6% | 79.5% |
| Median | 88.9% | 81.3% |
| Interquartile 25% (IQ1) | 86.3% | 74.2% |
| Interquartile 75% (IQ3) | 92.5% | 84.6% |
| Interquartile Range (IQR) | 6.2% | 10.5% |
| Standard Deviation (Sample) | 4.9% | 7.2% |
| Standard Deviation (Population) | 4.8% | 7.1% |
Similar Demographics by GED/Equivalency
Demographics Similar to Albanians by GED/Equivalency
In terms of ged/equivalency, the demographic groups most similar to Albanians are Immigrants from Asia (86.6%, a difference of 0.010%), Immigrants from Brazil (86.6%, a difference of 0.030%), Tsimshian (86.6%, a difference of 0.030%), Immigrants from Spain (86.7%, a difference of 0.040%), and Chilean (86.6%, a difference of 0.040%).
| Demographics | Rating | Rank | GED/Equivalency |
| Argentineans | 89.7 /100 | #127 | Excellent 86.7% |
| Yugoslavians | 89.5 /100 | #128 | Excellent 86.7% |
| Immigrants | Ukraine | 88.9 /100 | #129 | Excellent 86.7% |
| Immigrants | Germany | 88.8 /100 | #130 | Excellent 86.7% |
| Immigrants | Spain | 88.5 /100 | #131 | Excellent 86.7% |
| Immigrants | Brazil | 88.4 /100 | #132 | Excellent 86.6% |
| Tsimshian | 88.3 /100 | #133 | Excellent 86.6% |
| Albanians | 87.7 /100 | #134 | Excellent 86.6% |
| Immigrants | Asia | 87.4 /100 | #135 | Excellent 86.6% |
| Chileans | 86.9 /100 | #136 | Excellent 86.6% |
| Arabs | 86.7 /100 | #137 | Excellent 86.6% |
| Immigrants | Argentina | 86.5 /100 | #138 | Excellent 86.6% |
| Immigrants | Malaysia | 85.0 /100 | #139 | Excellent 86.5% |
| Paraguayans | 84.1 /100 | #140 | Excellent 86.5% |
| Laotians | 83.2 /100 | #141 | Excellent 86.5% |
Demographics Similar to Immigrants from the Azores by GED/Equivalency
In terms of ged/equivalency, the demographic groups most similar to Immigrants from the Azores are Immigrants from Honduras (78.7%, a difference of 0.11%), Salvadoran (78.6%, a difference of 0.11%), Guatemalan (78.5%, a difference of 0.20%), Immigrants from Latin America (78.5%, a difference of 0.22%), and Immigrants from Cabo Verde (78.9%, a difference of 0.36%).
| Demographics | Rating | Rank | GED/Equivalency |
| Hondurans | 0.0 /100 | #325 | Tragic 79.3% |
| Yuman | 0.0 /100 | #326 | Tragic 79.2% |
| Central Americans | 0.0 /100 | #327 | Tragic 79.2% |
| Hispanics or Latinos | 0.0 /100 | #328 | Tragic 79.1% |
| Dominicans | 0.0 /100 | #329 | Tragic 79.1% |
| Immigrants | Cabo Verde | 0.0 /100 | #330 | Tragic 78.9% |
| Immigrants | Honduras | 0.0 /100 | #331 | Tragic 78.7% |
| Immigrants | Azores | 0.0 /100 | #332 | Tragic 78.7% |
| Salvadorans | 0.0 /100 | #333 | Tragic 78.6% |
| Guatemalans | 0.0 /100 | #334 | Tragic 78.5% |
| Immigrants | Latin America | 0.0 /100 | #335 | Tragic 78.5% |
| Immigrants | Dominican Republic | 0.0 /100 | #336 | Tragic 78.0% |
| Immigrants | Yemen | 0.0 /100 | #337 | Tragic 77.9% |
| Immigrants | Guatemala | 0.0 /100 | #338 | Tragic 77.9% |
| Immigrants | El Salvador | 0.0 /100 | #339 | Tragic 77.6% |