Immigrants from Ecuador vs Immigrants from Syria GED/Equivalency
COMPARE
Immigrants from Ecuador
Immigrants from Syria
GED/Equivalency
GED/Equivalency Comparison
Immigrants from Ecuador
Immigrants from Syria
81.0%
GED/EQUIVALENCY
0.0/ 100
METRIC RATING
309th/ 347
METRIC RANK
86.1%
GED/EQUIVALENCY
69.3/ 100
METRIC RATING
161st/ 347
METRIC RANK
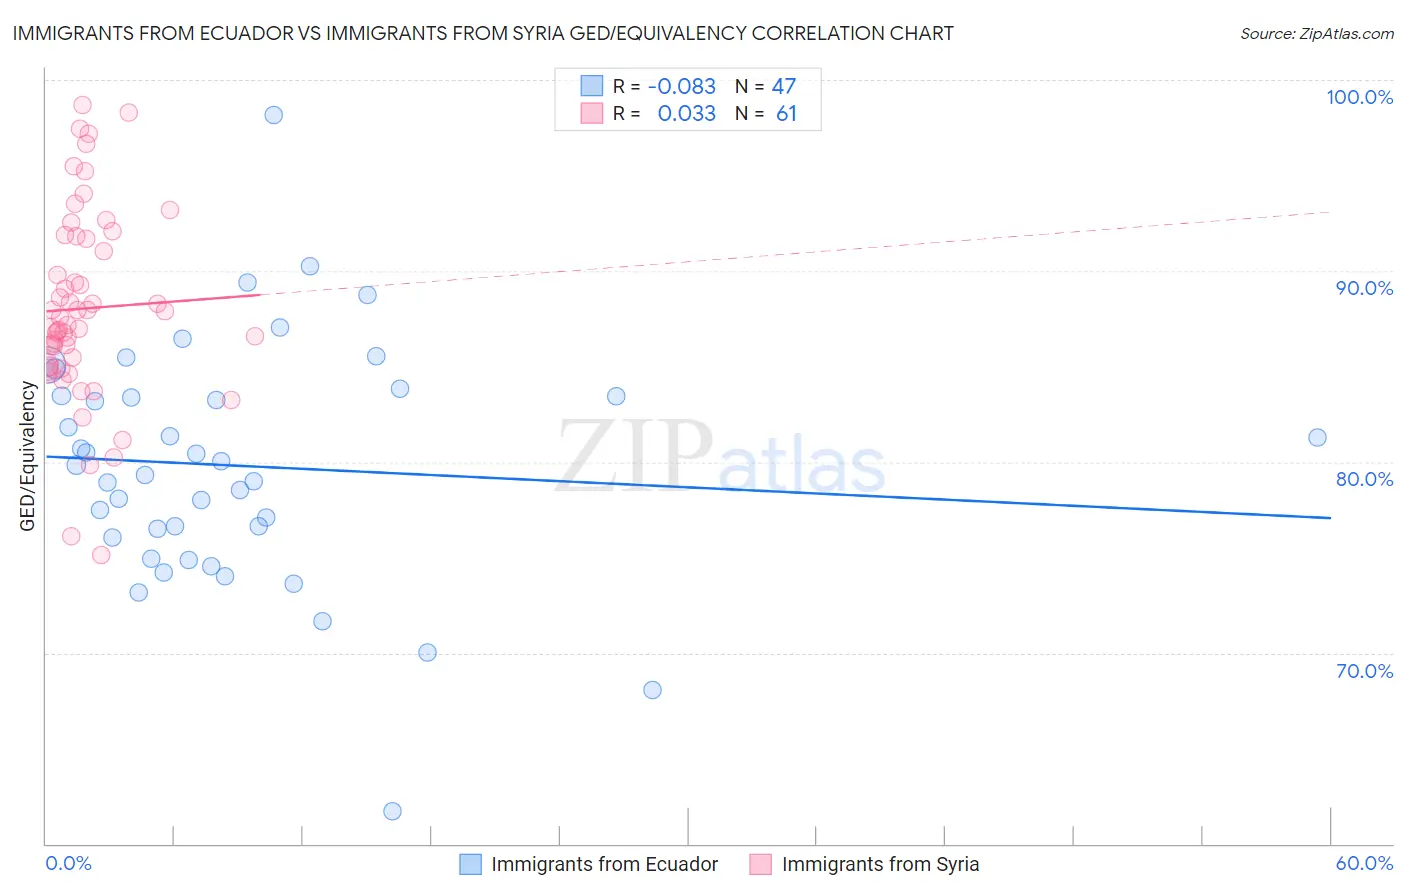
Immigrants from Ecuador vs Immigrants from Syria GED/Equivalency Correlation Chart
The statistical analysis conducted on geographies consisting of 271,020,679 people shows a slight negative correlation between the proportion of Immigrants from Ecuador and percentage of population with at least ged/equivalency education in the United States with a correlation coefficient (R) of -0.083 and weighted average of 81.0%. Similarly, the statistical analysis conducted on geographies consisting of 174,108,882 people shows no correlation between the proportion of Immigrants from Syria and percentage of population with at least ged/equivalency education in the United States with a correlation coefficient (R) of 0.033 and weighted average of 86.1%, a difference of 6.3%.
GED/Equivalency Correlation Summary
| Measurement | Immigrants from Ecuador | Immigrants from Syria |
| Minimum | 61.7% | 75.1% |
| Maximum | 98.2% | 98.7% |
| Range | 36.5% | 23.5% |
| Mean | 79.8% | 88.0% |
| Median | 79.8% | 87.1% |
| Interquartile 25% (IQ1) | 76.0% | 85.0% |
| Interquartile 75% (IQ3) | 83.5% | 91.8% |
| Interquartile Range (IQR) | 7.5% | 6.7% |
| Standard Deviation (Sample) | 6.3% | 5.0% |
| Standard Deviation (Population) | 6.3% | 4.9% |
Similar Demographics by GED/Equivalency
Demographics Similar to Immigrants from Ecuador by GED/Equivalency
In terms of ged/equivalency, the demographic groups most similar to Immigrants from Ecuador are Immigrants from Guyana (81.0%, a difference of 0.060%), Native/Alaskan (80.9%, a difference of 0.070%), Puerto Rican (81.1%, a difference of 0.080%), Nicaraguan (80.9%, a difference of 0.10%), and Cape Verdean (80.9%, a difference of 0.10%).
| Demographics | Rating | Rank | GED/Equivalency |
| Immigrants | Haiti | 0.0 /100 | #302 | Tragic 81.6% |
| Immigrants | Portugal | 0.0 /100 | #303 | Tragic 81.6% |
| Navajo | 0.0 /100 | #304 | Tragic 81.5% |
| Immigrants | Grenada | 0.0 /100 | #305 | Tragic 81.3% |
| Guyanese | 0.0 /100 | #306 | Tragic 81.3% |
| Immigrants | Dominica | 0.0 /100 | #307 | Tragic 81.1% |
| Puerto Ricans | 0.0 /100 | #308 | Tragic 81.1% |
| Immigrants | Ecuador | 0.0 /100 | #309 | Tragic 81.0% |
| Immigrants | Guyana | 0.0 /100 | #310 | Tragic 81.0% |
| Natives/Alaskans | 0.0 /100 | #311 | Tragic 80.9% |
| Nicaraguans | 0.0 /100 | #312 | Tragic 80.9% |
| Cape Verdeans | 0.0 /100 | #313 | Tragic 80.9% |
| Belizeans | 0.0 /100 | #314 | Tragic 80.9% |
| Apache | 0.0 /100 | #315 | Tragic 80.7% |
| Central American Indians | 0.0 /100 | #316 | Tragic 80.6% |
Demographics Similar to Immigrants from Syria by GED/Equivalency
In terms of ged/equivalency, the demographic groups most similar to Immigrants from Syria are Immigrants from Morocco (86.1%, a difference of 0.010%), Immigrants from Iraq (86.1%, a difference of 0.030%), Immigrants from Kenya (86.2%, a difference of 0.060%), White/Caucasian (86.2%, a difference of 0.070%), and German Russian (86.2%, a difference of 0.070%).
| Demographics | Rating | Rank | GED/Equivalency |
| Armenians | 76.4 /100 | #154 | Good 86.3% |
| Iraqis | 75.2 /100 | #155 | Good 86.2% |
| Immigrants | Nepal | 73.3 /100 | #156 | Good 86.2% |
| Whites/Caucasians | 72.2 /100 | #157 | Good 86.2% |
| German Russians | 72.1 /100 | #158 | Good 86.2% |
| Immigrants | Kenya | 71.8 /100 | #159 | Good 86.2% |
| Immigrants | Morocco | 69.5 /100 | #160 | Good 86.1% |
| Immigrants | Syria | 69.3 /100 | #161 | Good 86.1% |
| Immigrants | Iraq | 68.1 /100 | #162 | Good 86.1% |
| Ugandans | 66.3 /100 | #163 | Good 86.1% |
| Venezuelans | 65.5 /100 | #164 | Good 86.0% |
| Alsatians | 64.3 /100 | #165 | Good 86.0% |
| Immigrants | Albania | 64.2 /100 | #166 | Good 86.0% |
| Ethiopians | 63.7 /100 | #167 | Good 86.0% |
| Sierra Leoneans | 61.8 /100 | #168 | Good 86.0% |