Pennsylvania German vs Immigrants from Syria GED/Equivalency
COMPARE
Pennsylvania German
Immigrants from Syria
GED/Equivalency
GED/Equivalency Comparison
Pennsylvania Germans
Immigrants from Syria
82.9%
GED/EQUIVALENCY
0.1/ 100
METRIC RATING
273rd/ 347
METRIC RANK
86.1%
GED/EQUIVALENCY
69.3/ 100
METRIC RATING
161st/ 347
METRIC RANK
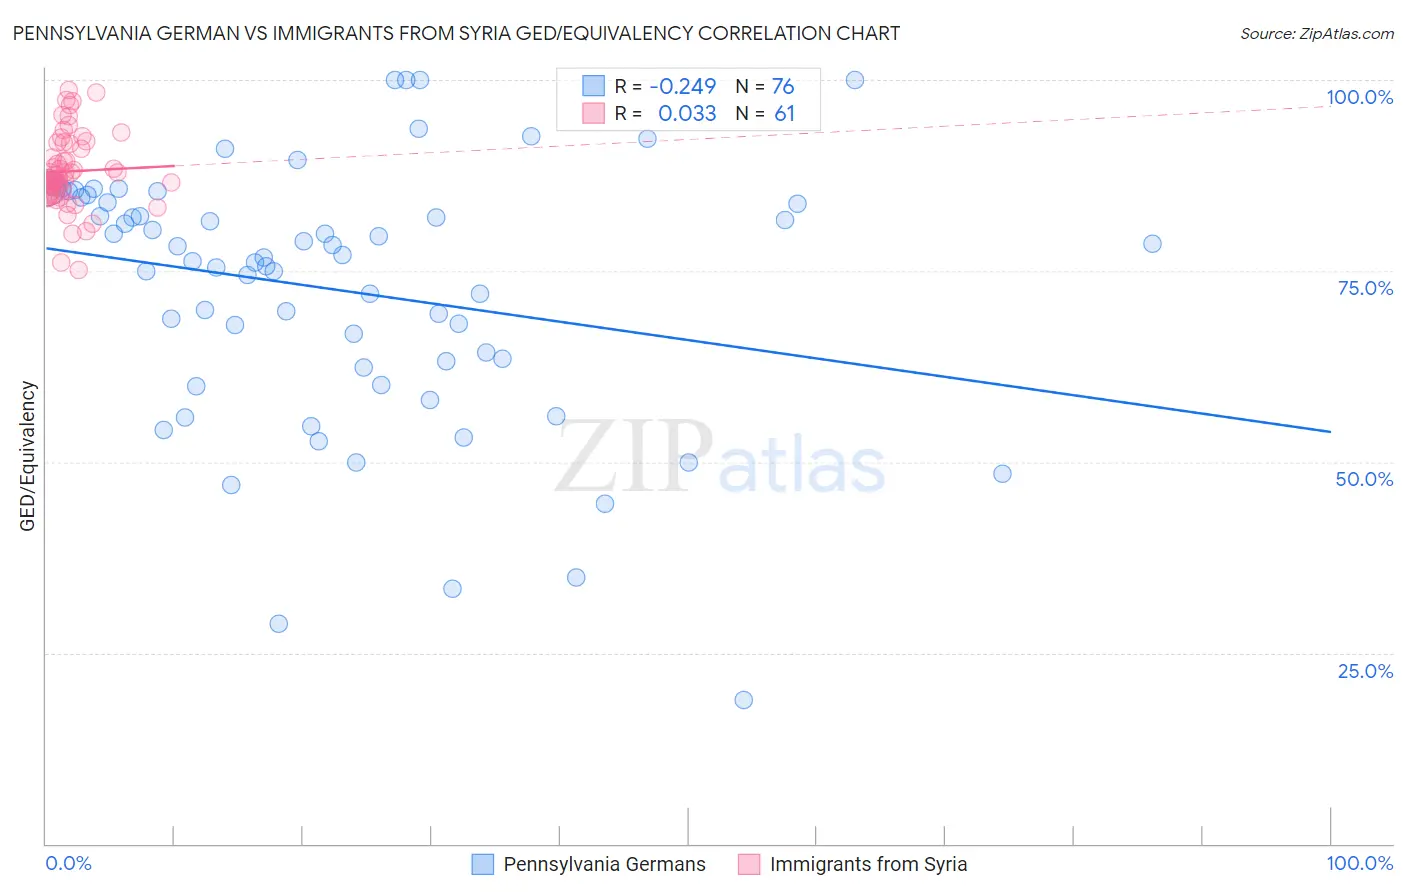
Pennsylvania German vs Immigrants from Syria GED/Equivalency Correlation Chart
The statistical analysis conducted on geographies consisting of 234,102,935 people shows a weak negative correlation between the proportion of Pennsylvania Germans and percentage of population with at least ged/equivalency education in the United States with a correlation coefficient (R) of -0.249 and weighted average of 82.9%. Similarly, the statistical analysis conducted on geographies consisting of 174,108,882 people shows no correlation between the proportion of Immigrants from Syria and percentage of population with at least ged/equivalency education in the United States with a correlation coefficient (R) of 0.033 and weighted average of 86.1%, a difference of 3.9%.
GED/Equivalency Correlation Summary
| Measurement | Pennsylvania German | Immigrants from Syria |
| Minimum | 18.8% | 75.1% |
| Maximum | 100.0% | 98.7% |
| Range | 81.2% | 23.5% |
| Mean | 72.5% | 88.0% |
| Median | 76.5% | 87.1% |
| Interquartile 25% (IQ1) | 62.8% | 85.0% |
| Interquartile 75% (IQ3) | 84.3% | 91.8% |
| Interquartile Range (IQR) | 21.5% | 6.7% |
| Standard Deviation (Sample) | 17.0% | 5.0% |
| Standard Deviation (Population) | 16.9% | 4.9% |
Similar Demographics by GED/Equivalency
Demographics Similar to Pennsylvania Germans by GED/Equivalency
In terms of ged/equivalency, the demographic groups most similar to Pennsylvania Germans are Barbadian (82.9%, a difference of 0.010%), Immigrants from Trinidad and Tobago (82.8%, a difference of 0.020%), U.S. Virgin Islander (82.9%, a difference of 0.050%), Seminole (82.8%, a difference of 0.080%), and Immigrants from Jamaica (82.9%, a difference of 0.090%).
| Demographics | Rating | Rank | GED/Equivalency |
| Kiowa | 0.2 /100 | #266 | Tragic 83.1% |
| Trinidadians and Tobagonians | 0.2 /100 | #267 | Tragic 83.0% |
| Immigrants | Burma/Myanmar | 0.2 /100 | #268 | Tragic 83.0% |
| Hopi | 0.2 /100 | #269 | Tragic 83.0% |
| Immigrants | Jamaica | 0.2 /100 | #270 | Tragic 82.9% |
| U.S. Virgin Islanders | 0.2 /100 | #271 | Tragic 82.9% |
| Barbadians | 0.1 /100 | #272 | Tragic 82.9% |
| Pennsylvania Germans | 0.1 /100 | #273 | Tragic 82.9% |
| Immigrants | Trinidad and Tobago | 0.1 /100 | #274 | Tragic 82.8% |
| Seminole | 0.1 /100 | #275 | Tragic 82.8% |
| Blacks/African Americans | 0.1 /100 | #276 | Tragic 82.8% |
| Arapaho | 0.1 /100 | #277 | Tragic 82.8% |
| Immigrants | Laos | 0.1 /100 | #278 | Tragic 82.7% |
| Immigrants | Fiji | 0.1 /100 | #279 | Tragic 82.7% |
| Cheyenne | 0.1 /100 | #280 | Tragic 82.7% |
Demographics Similar to Immigrants from Syria by GED/Equivalency
In terms of ged/equivalency, the demographic groups most similar to Immigrants from Syria are Immigrants from Morocco (86.1%, a difference of 0.010%), Immigrants from Iraq (86.1%, a difference of 0.030%), Immigrants from Kenya (86.2%, a difference of 0.060%), White/Caucasian (86.2%, a difference of 0.070%), and German Russian (86.2%, a difference of 0.070%).
| Demographics | Rating | Rank | GED/Equivalency |
| Armenians | 76.4 /100 | #154 | Good 86.3% |
| Iraqis | 75.2 /100 | #155 | Good 86.2% |
| Immigrants | Nepal | 73.3 /100 | #156 | Good 86.2% |
| Whites/Caucasians | 72.2 /100 | #157 | Good 86.2% |
| German Russians | 72.1 /100 | #158 | Good 86.2% |
| Immigrants | Kenya | 71.8 /100 | #159 | Good 86.2% |
| Immigrants | Morocco | 69.5 /100 | #160 | Good 86.1% |
| Immigrants | Syria | 69.3 /100 | #161 | Good 86.1% |
| Immigrants | Iraq | 68.1 /100 | #162 | Good 86.1% |
| Ugandans | 66.3 /100 | #163 | Good 86.1% |
| Venezuelans | 65.5 /100 | #164 | Good 86.0% |
| Alsatians | 64.3 /100 | #165 | Good 86.0% |
| Immigrants | Albania | 64.2 /100 | #166 | Good 86.0% |
| Ethiopians | 63.7 /100 | #167 | Good 86.0% |
| Sierra Leoneans | 61.8 /100 | #168 | Good 86.0% |