Albanian vs Immigrants from Uganda GED/Equivalency
COMPARE
Albanian
Immigrants from Uganda
GED/Equivalency
GED/Equivalency Comparison
Albanians
Immigrants from Uganda
86.6%
GED/EQUIVALENCY
87.7/ 100
METRIC RATING
134th/ 347
METRIC RANK
85.7%
GED/EQUIVALENCY
45.2/ 100
METRIC RATING
177th/ 347
METRIC RANK
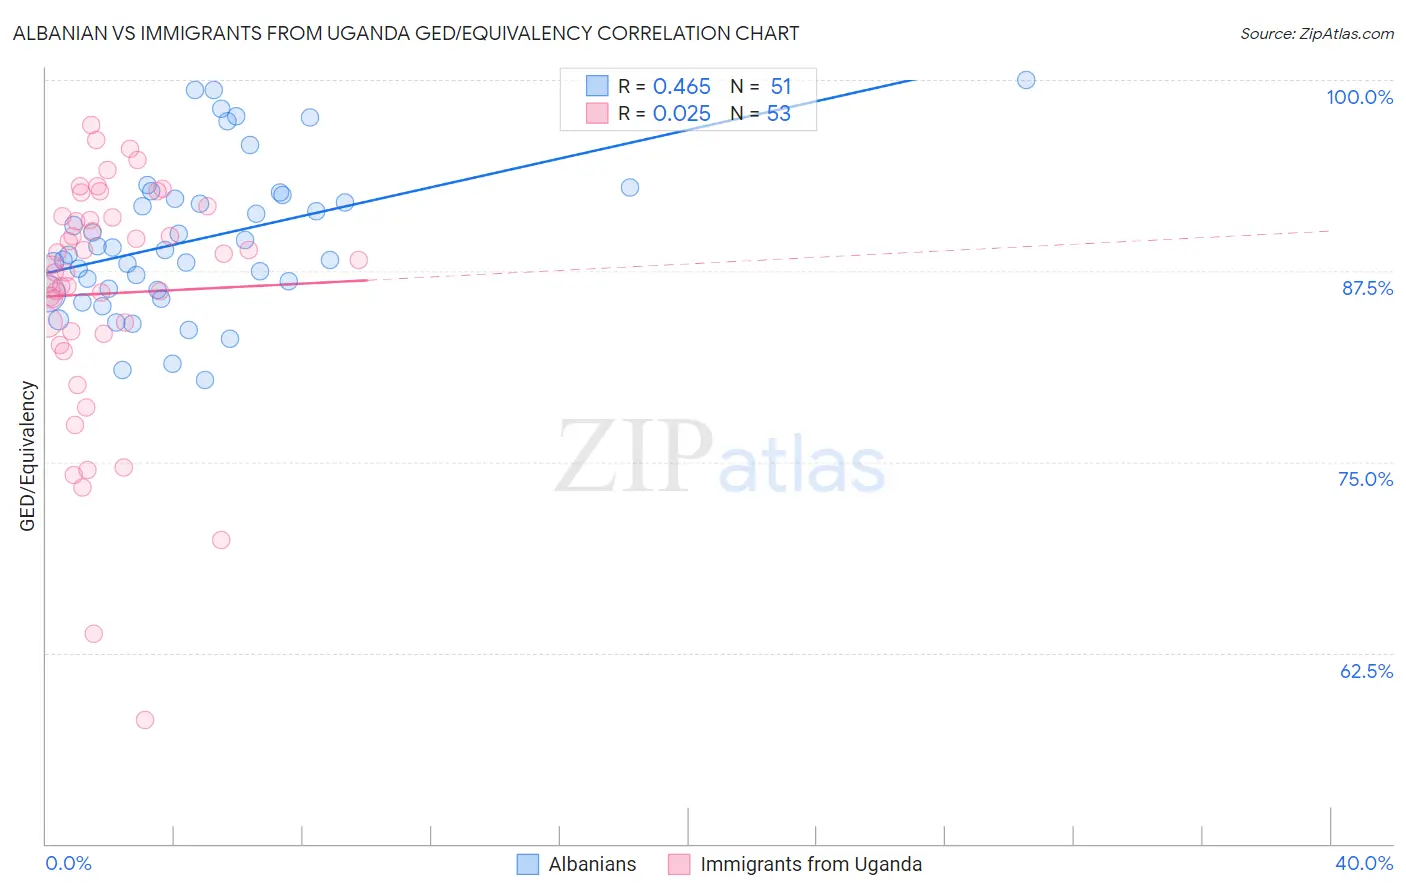
Albanian vs Immigrants from Uganda GED/Equivalency Correlation Chart
The statistical analysis conducted on geographies consisting of 193,265,279 people shows a moderate positive correlation between the proportion of Albanians and percentage of population with at least ged/equivalency education in the United States with a correlation coefficient (R) of 0.465 and weighted average of 86.6%. Similarly, the statistical analysis conducted on geographies consisting of 125,982,219 people shows no correlation between the proportion of Immigrants from Uganda and percentage of population with at least ged/equivalency education in the United States with a correlation coefficient (R) of 0.025 and weighted average of 85.7%, a difference of 1.1%.
GED/Equivalency Correlation Summary
| Measurement | Albanian | Immigrants from Uganda |
| Minimum | 80.3% | 58.1% |
| Maximum | 100.0% | 97.1% |
| Range | 19.7% | 39.0% |
| Mean | 89.6% | 86.0% |
| Median | 88.9% | 87.9% |
| Interquartile 25% (IQ1) | 86.3% | 83.5% |
| Interquartile 75% (IQ3) | 92.5% | 91.1% |
| Interquartile Range (IQR) | 6.2% | 7.6% |
| Standard Deviation (Sample) | 4.9% | 8.0% |
| Standard Deviation (Population) | 4.8% | 7.9% |
Similar Demographics by GED/Equivalency
Demographics Similar to Albanians by GED/Equivalency
In terms of ged/equivalency, the demographic groups most similar to Albanians are Immigrants from Asia (86.6%, a difference of 0.010%), Immigrants from Brazil (86.6%, a difference of 0.030%), Tsimshian (86.6%, a difference of 0.030%), Immigrants from Spain (86.7%, a difference of 0.040%), and Chilean (86.6%, a difference of 0.040%).
| Demographics | Rating | Rank | GED/Equivalency |
| Argentineans | 89.7 /100 | #127 | Excellent 86.7% |
| Yugoslavians | 89.5 /100 | #128 | Excellent 86.7% |
| Immigrants | Ukraine | 88.9 /100 | #129 | Excellent 86.7% |
| Immigrants | Germany | 88.8 /100 | #130 | Excellent 86.7% |
| Immigrants | Spain | 88.5 /100 | #131 | Excellent 86.7% |
| Immigrants | Brazil | 88.4 /100 | #132 | Excellent 86.6% |
| Tsimshian | 88.3 /100 | #133 | Excellent 86.6% |
| Albanians | 87.7 /100 | #134 | Excellent 86.6% |
| Immigrants | Asia | 87.4 /100 | #135 | Excellent 86.6% |
| Chileans | 86.9 /100 | #136 | Excellent 86.6% |
| Arabs | 86.7 /100 | #137 | Excellent 86.6% |
| Immigrants | Argentina | 86.5 /100 | #138 | Excellent 86.6% |
| Immigrants | Malaysia | 85.0 /100 | #139 | Excellent 86.5% |
| Paraguayans | 84.1 /100 | #140 | Excellent 86.5% |
| Laotians | 83.2 /100 | #141 | Excellent 86.5% |
Demographics Similar to Immigrants from Uganda by GED/Equivalency
In terms of ged/equivalency, the demographic groups most similar to Immigrants from Uganda are Immigrants from Eastern Africa (85.7%, a difference of 0.050%), Korean (85.6%, a difference of 0.080%), Ottawa (85.8%, a difference of 0.10%), Immigrants from Bolivia (85.8%, a difference of 0.10%), and Aleut (85.6%, a difference of 0.10%).
| Demographics | Rating | Rank | GED/Equivalency |
| Afghans | 59.7 /100 | #170 | Average 85.9% |
| Immigrants | Chile | 57.3 /100 | #171 | Average 85.9% |
| Bermudans | 55.1 /100 | #172 | Average 85.8% |
| Immigrants | Venezuela | 50.7 /100 | #173 | Average 85.8% |
| Ottawa | 50.0 /100 | #174 | Average 85.8% |
| Immigrants | Bolivia | 49.8 /100 | #175 | Average 85.8% |
| Immigrants | Eastern Africa | 47.7 /100 | #176 | Average 85.7% |
| Immigrants | Uganda | 45.2 /100 | #177 | Average 85.7% |
| Koreans | 41.2 /100 | #178 | Average 85.6% |
| Aleuts | 40.5 /100 | #179 | Average 85.6% |
| Immigrants | Southern Europe | 38.4 /100 | #180 | Fair 85.5% |
| Moroccans | 37.7 /100 | #181 | Fair 85.5% |
| Sudanese | 35.2 /100 | #182 | Fair 85.5% |
| Immigrants | Sudan | 34.2 /100 | #183 | Fair 85.5% |
| Immigrants | Oceania | 33.6 /100 | #184 | Fair 85.5% |