Alaskan Athabascan vs Immigrants from Zaire GED/Equivalency
COMPARE
Alaskan Athabascan
Immigrants from Zaire
GED/Equivalency
GED/Equivalency Comparison
Alaskan Athabascans
Immigrants from Zaire
85.3%
GED/EQUIVALENCY
27.5/ 100
METRIC RATING
190th/ 347
METRIC RANK
84.5%
GED/EQUIVALENCY
5.5/ 100
METRIC RATING
226th/ 347
METRIC RANK
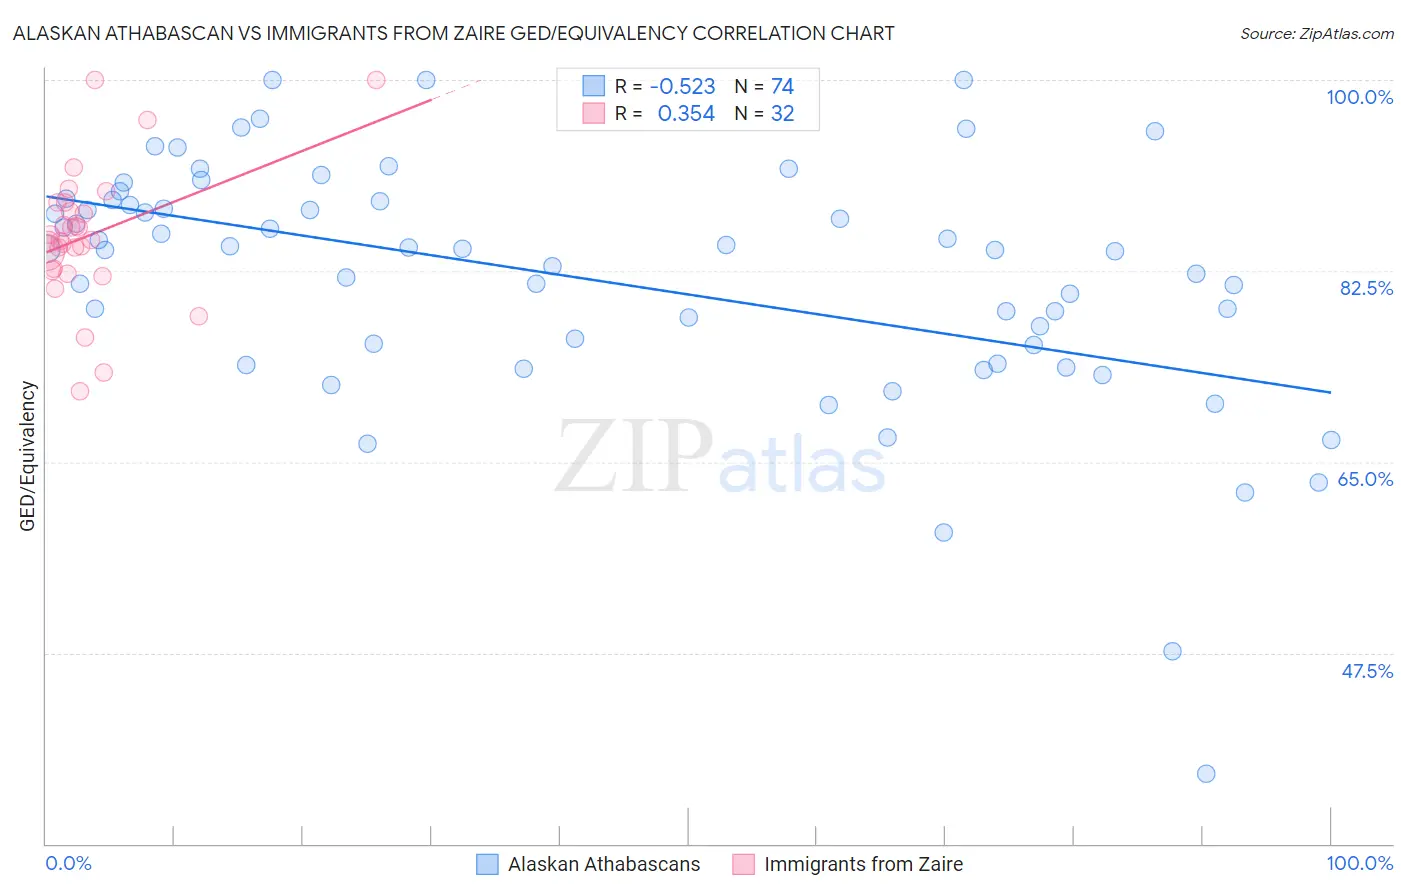
Alaskan Athabascan vs Immigrants from Zaire GED/Equivalency Correlation Chart
The statistical analysis conducted on geographies consisting of 45,820,221 people shows a substantial negative correlation between the proportion of Alaskan Athabascans and percentage of population with at least ged/equivalency education in the United States with a correlation coefficient (R) of -0.523 and weighted average of 85.3%. Similarly, the statistical analysis conducted on geographies consisting of 107,255,805 people shows a mild positive correlation between the proportion of Immigrants from Zaire and percentage of population with at least ged/equivalency education in the United States with a correlation coefficient (R) of 0.354 and weighted average of 84.5%, a difference of 0.97%.
GED/Equivalency Correlation Summary
| Measurement | Alaskan Athabascan | Immigrants from Zaire |
| Minimum | 36.4% | 71.4% |
| Maximum | 100.0% | 100.0% |
| Range | 63.6% | 28.6% |
| Mean | 81.7% | 85.7% |
| Median | 84.5% | 85.3% |
| Interquartile 25% (IQ1) | 75.7% | 82.6% |
| Interquartile 75% (IQ3) | 88.9% | 88.4% |
| Interquartile Range (IQR) | 13.2% | 5.8% |
| Standard Deviation (Sample) | 11.4% | 6.2% |
| Standard Deviation (Population) | 11.3% | 6.1% |
Similar Demographics by GED/Equivalency
Demographics Similar to Alaskan Athabascans by GED/Equivalency
In terms of ged/equivalency, the demographic groups most similar to Alaskan Athabascans are Guamanian/Chamorro (85.3%, a difference of 0.020%), Immigrants from Sierra Leone (85.4%, a difference of 0.040%), Immigrants from Afghanistan (85.4%, a difference of 0.060%), Spaniard (85.4%, a difference of 0.11%), and Spanish (85.4%, a difference of 0.13%).
| Demographics | Rating | Rank | GED/Equivalency |
| Immigrants | Sudan | 34.2 /100 | #183 | Fair 85.5% |
| Immigrants | Oceania | 33.6 /100 | #184 | Fair 85.5% |
| Spanish | 32.8 /100 | #185 | Fair 85.4% |
| Spaniards | 31.9 /100 | #186 | Fair 85.4% |
| Immigrants | Afghanistan | 29.8 /100 | #187 | Fair 85.4% |
| Immigrants | Sierra Leone | 29.0 /100 | #188 | Fair 85.4% |
| Guamanians/Chamorros | 28.4 /100 | #189 | Fair 85.3% |
| Alaskan Athabascans | 27.5 /100 | #190 | Fair 85.3% |
| South American Indians | 22.8 /100 | #191 | Fair 85.2% |
| Immigrants | Nonimmigrants | 22.7 /100 | #192 | Fair 85.2% |
| Delaware | 22.2 /100 | #193 | Fair 85.2% |
| Puget Sound Salish | 20.8 /100 | #194 | Fair 85.2% |
| Chippewa | 20.8 /100 | #195 | Fair 85.2% |
| Tongans | 20.7 /100 | #196 | Fair 85.2% |
| Costa Ricans | 20.4 /100 | #197 | Fair 85.2% |
Demographics Similar to Immigrants from Zaire by GED/Equivalency
In terms of ged/equivalency, the demographic groups most similar to Immigrants from Zaire are Immigrants from Costa Rica (84.5%, a difference of 0.010%), Immigrants from Thailand (84.5%, a difference of 0.020%), Immigrants from Liberia (84.4%, a difference of 0.070%), French American Indian (84.6%, a difference of 0.080%), and Immigrants from Uruguay (84.4%, a difference of 0.10%).
| Demographics | Rating | Rank | GED/Equivalency |
| Potawatomi | 8.2 /100 | #219 | Tragic 84.7% |
| Americans | 8.2 /100 | #220 | Tragic 84.7% |
| Taiwanese | 8.1 /100 | #221 | Tragic 84.7% |
| Iroquois | 7.5 /100 | #222 | Tragic 84.6% |
| Immigrants | Uzbekistan | 7.1 /100 | #223 | Tragic 84.6% |
| French American Indians | 6.3 /100 | #224 | Tragic 84.6% |
| Immigrants | Thailand | 5.8 /100 | #225 | Tragic 84.5% |
| Immigrants | Zaire | 5.5 /100 | #226 | Tragic 84.5% |
| Immigrants | Costa Rica | 5.4 /100 | #227 | Tragic 84.5% |
| Immigrants | Liberia | 4.9 /100 | #228 | Tragic 84.4% |
| Immigrants | Uruguay | 4.6 /100 | #229 | Tragic 84.4% |
| Immigrants | Colombia | 4.5 /100 | #230 | Tragic 84.4% |
| Immigrants | Middle Africa | 4.3 /100 | #231 | Tragic 84.4% |
| Immigrants | South America | 4.2 /100 | #232 | Tragic 84.4% |
| Immigrants | Panama | 4.1 /100 | #233 | Tragic 84.4% |