Alaskan Athabascan vs Immigrants from Zaire Householder Income Ages 45 - 64 years
COMPARE
Alaskan Athabascan
Immigrants from Zaire
Householder Income Ages 45 - 64 years
Householder Income Ages 45 - 64 years Comparison
Alaskan Athabascans
Immigrants from Zaire
$90,951
HOUSEHOLDER INCOME AGES 45 - 64 YEARS
0.9/ 100
METRIC RATING
247th/ 347
METRIC RANK
$85,207
HOUSEHOLDER INCOME AGES 45 - 64 YEARS
0.1/ 100
METRIC RATING
296th/ 347
METRIC RANK
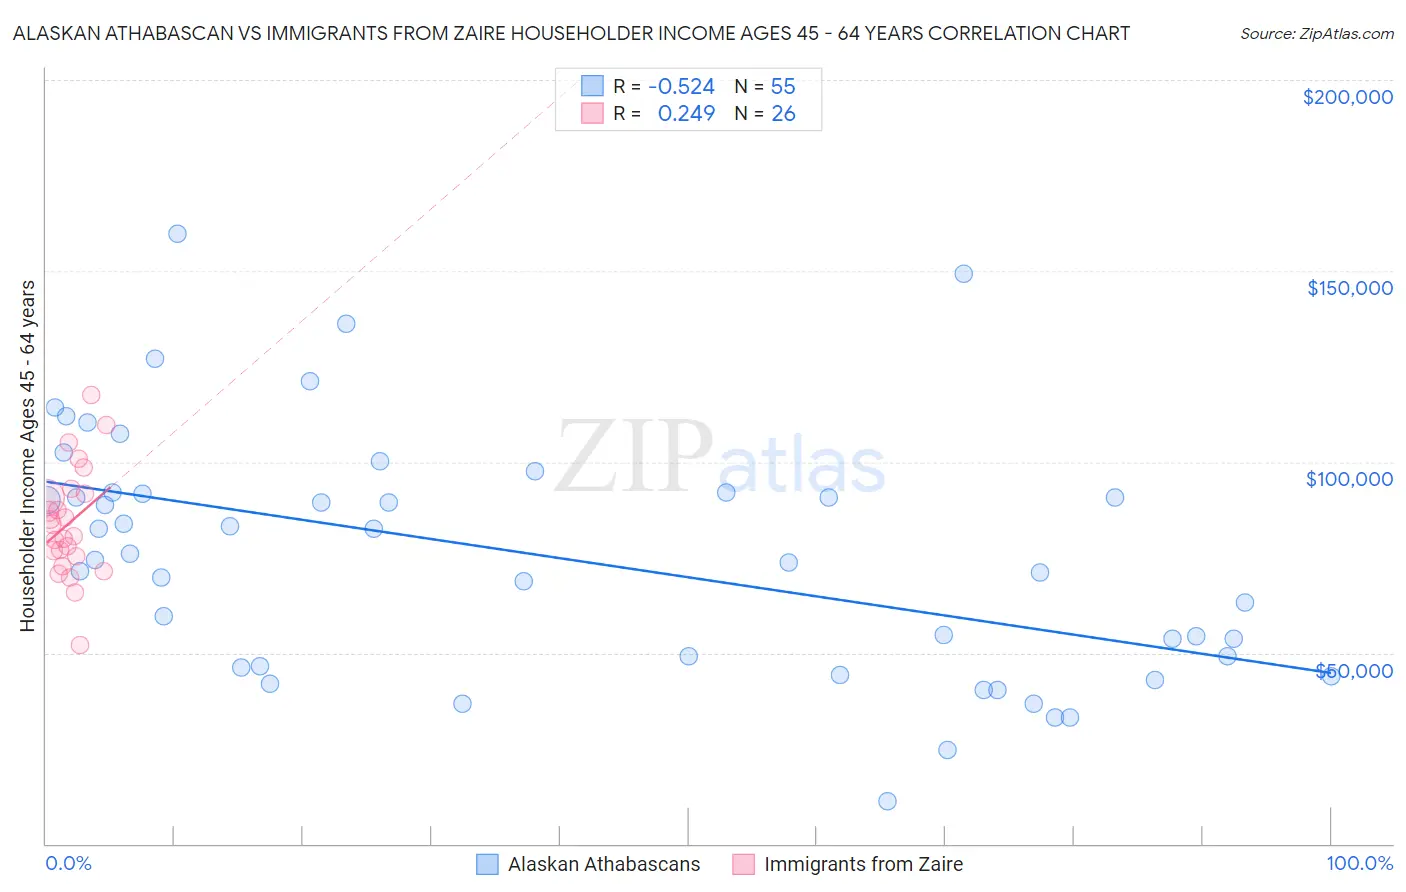
Alaskan Athabascan vs Immigrants from Zaire Householder Income Ages 45 - 64 years Correlation Chart
The statistical analysis conducted on geographies consisting of 45,798,258 people shows a substantial negative correlation between the proportion of Alaskan Athabascans and household income with householder between the ages 45 and 64 in the United States with a correlation coefficient (R) of -0.524 and weighted average of $90,951. Similarly, the statistical analysis conducted on geographies consisting of 107,222,169 people shows a weak positive correlation between the proportion of Immigrants from Zaire and household income with householder between the ages 45 and 64 in the United States with a correlation coefficient (R) of 0.249 and weighted average of $85,207, a difference of 6.7%.
Householder Income Ages 45 - 64 years Correlation Summary
| Measurement | Alaskan Athabascan | Immigrants from Zaire |
| Minimum | $11,250 | $51,937 |
| Maximum | $159,813 | $117,531 |
| Range | $148,563 | $65,594 |
| Mean | $75,223 | $84,004 |
| Median | $74,256 | $82,074 |
| Interquartile 25% (IQ1) | $46,429 | $75,184 |
| Interquartile 75% (IQ3) | $91,990 | $91,518 |
| Interquartile Range (IQR) | $45,561 | $16,334 |
| Standard Deviation (Sample) | $32,152 | $14,467 |
| Standard Deviation (Population) | $31,858 | $14,186 |
Similar Demographics by Householder Income Ages 45 - 64 years
Demographics Similar to Alaskan Athabascans by Householder Income Ages 45 - 64 years
In terms of householder income ages 45 - 64 years, the demographic groups most similar to Alaskan Athabascans are Central American ($90,951, a difference of 0.0%), Guyanese ($90,966, a difference of 0.020%), Immigrants from Laos ($90,909, a difference of 0.050%), Mexican American Indian ($90,811, a difference of 0.15%), and Subsaharan African ($90,691, a difference of 0.29%).
| Demographics | Rating | Rank | Householder Income Ages 45 - 64 years |
| Immigrants | Burma/Myanmar | 1.1 /100 | #240 | Tragic $91,385 |
| Trinidadians and Tobagonians | 1.1 /100 | #241 | Tragic $91,357 |
| Inupiat | 1.1 /100 | #242 | Tragic $91,355 |
| Immigrants | Trinidad and Tobago | 1.1 /100 | #243 | Tragic $91,347 |
| Immigrants | Middle Africa | 1.1 /100 | #244 | Tragic $91,293 |
| Guyanese | 0.9 /100 | #245 | Tragic $90,966 |
| Central Americans | 0.9 /100 | #246 | Tragic $90,951 |
| Alaskan Athabascans | 0.9 /100 | #247 | Tragic $90,951 |
| Immigrants | Laos | 0.9 /100 | #248 | Tragic $90,909 |
| Mexican American Indians | 0.8 /100 | #249 | Tragic $90,811 |
| Sub-Saharan Africans | 0.8 /100 | #250 | Tragic $90,691 |
| Americans | 0.7 /100 | #251 | Tragic $90,536 |
| Marshallese | 0.7 /100 | #252 | Tragic $90,455 |
| Barbadians | 0.6 /100 | #253 | Tragic $90,266 |
| Immigrants | Guyana | 0.6 /100 | #254 | Tragic $90,186 |
Demographics Similar to Immigrants from Zaire by Householder Income Ages 45 - 64 years
In terms of householder income ages 45 - 64 years, the demographic groups most similar to Immigrants from Zaire are Fijian ($85,187, a difference of 0.020%), African ($84,925, a difference of 0.33%), Immigrants from Mexico ($84,910, a difference of 0.35%), Indonesian ($84,890, a difference of 0.37%), and Immigrants from Grenada ($85,552, a difference of 0.40%).
| Demographics | Rating | Rank | Householder Income Ages 45 - 64 years |
| Cubans | 0.1 /100 | #289 | Tragic $86,301 |
| Cherokee | 0.1 /100 | #290 | Tragic $86,125 |
| Hispanics or Latinos | 0.1 /100 | #291 | Tragic $86,006 |
| Immigrants | Central America | 0.1 /100 | #292 | Tragic $85,965 |
| Comanche | 0.1 /100 | #293 | Tragic $85,787 |
| British West Indians | 0.1 /100 | #294 | Tragic $85,571 |
| Immigrants | Grenada | 0.1 /100 | #295 | Tragic $85,552 |
| Immigrants | Zaire | 0.1 /100 | #296 | Tragic $85,207 |
| Fijians | 0.1 /100 | #297 | Tragic $85,187 |
| Africans | 0.0 /100 | #298 | Tragic $84,925 |
| Immigrants | Mexico | 0.0 /100 | #299 | Tragic $84,910 |
| Indonesians | 0.0 /100 | #300 | Tragic $84,890 |
| Potawatomi | 0.0 /100 | #301 | Tragic $84,613 |
| Haitians | 0.0 /100 | #302 | Tragic $84,384 |
| Hondurans | 0.0 /100 | #303 | Tragic $84,079 |