Alaskan Athabascan vs Immigrants from Yemen GED/Equivalency
COMPARE
Alaskan Athabascan
Immigrants from Yemen
GED/Equivalency
GED/Equivalency Comparison
Alaskan Athabascans
Immigrants from Yemen
85.3%
GED/EQUIVALENCY
27.5/ 100
METRIC RATING
190th/ 347
METRIC RANK
77.9%
GED/EQUIVALENCY
0.0/ 100
METRIC RATING
337th/ 347
METRIC RANK
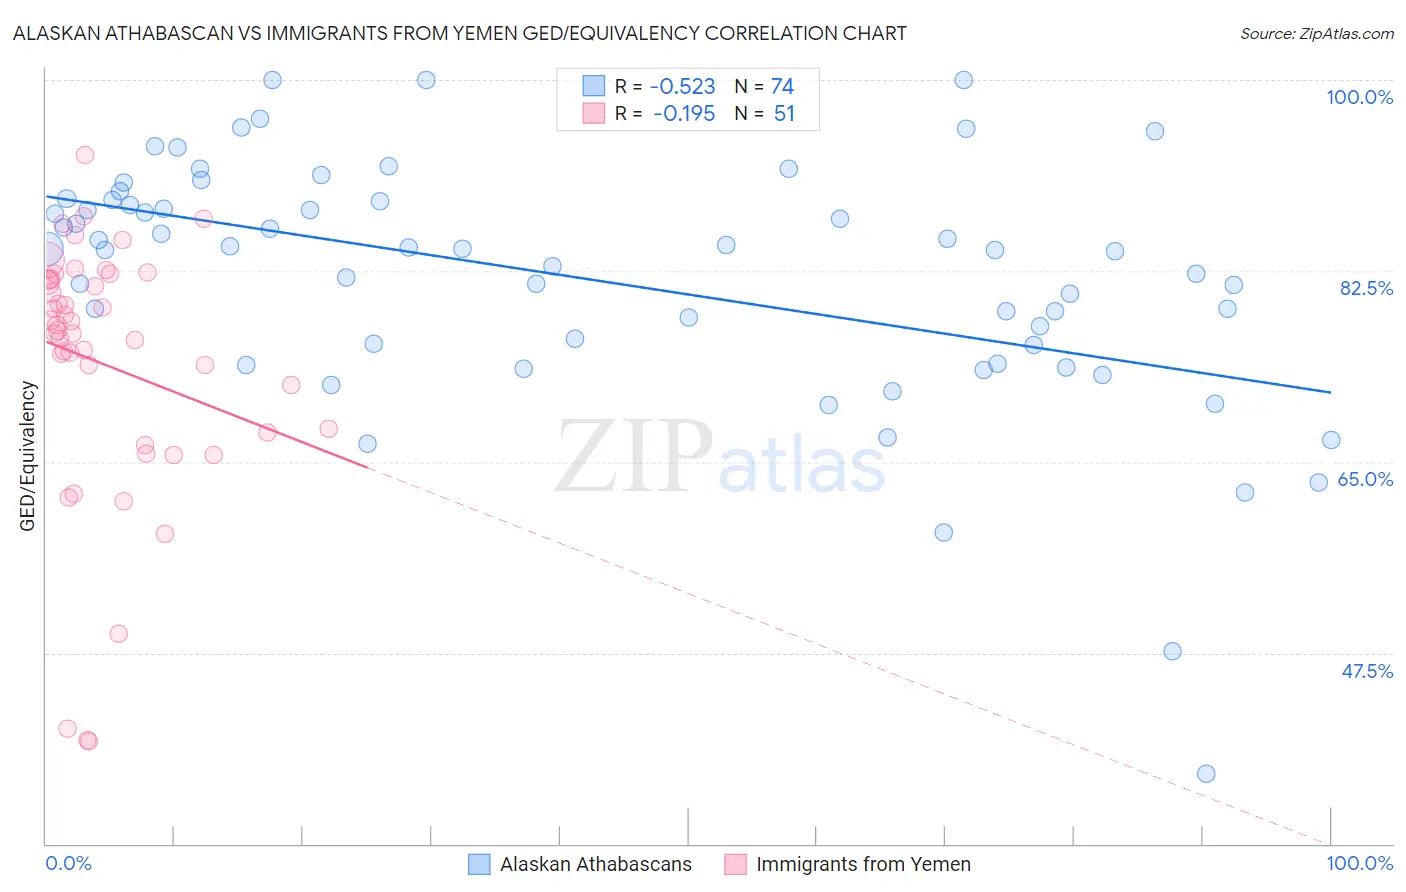
Alaskan Athabascan vs Immigrants from Yemen GED/Equivalency Correlation Chart
The statistical analysis conducted on geographies consisting of 45,820,221 people shows a substantial negative correlation between the proportion of Alaskan Athabascans and percentage of population with at least ged/equivalency education in the United States with a correlation coefficient (R) of -0.523 and weighted average of 85.3%. Similarly, the statistical analysis conducted on geographies consisting of 82,433,611 people shows a poor negative correlation between the proportion of Immigrants from Yemen and percentage of population with at least ged/equivalency education in the United States with a correlation coefficient (R) of -0.195 and weighted average of 77.9%, a difference of 9.5%.
GED/Equivalency Correlation Summary
| Measurement | Alaskan Athabascan | Immigrants from Yemen |
| Minimum | 36.4% | 39.4% |
| Maximum | 100.0% | 93.1% |
| Range | 63.6% | 53.7% |
| Mean | 81.7% | 73.9% |
| Median | 84.5% | 77.0% |
| Interquartile 25% (IQ1) | 75.7% | 67.7% |
| Interquartile 75% (IQ3) | 88.9% | 81.8% |
| Interquartile Range (IQR) | 13.2% | 14.1% |
| Standard Deviation (Sample) | 11.4% | 12.0% |
| Standard Deviation (Population) | 11.3% | 11.9% |
Similar Demographics by GED/Equivalency
Demographics Similar to Alaskan Athabascans by GED/Equivalency
In terms of ged/equivalency, the demographic groups most similar to Alaskan Athabascans are Guamanian/Chamorro (85.3%, a difference of 0.020%), Immigrants from Sierra Leone (85.4%, a difference of 0.040%), Immigrants from Afghanistan (85.4%, a difference of 0.060%), Spaniard (85.4%, a difference of 0.11%), and Spanish (85.4%, a difference of 0.13%).
| Demographics | Rating | Rank | GED/Equivalency |
| Immigrants | Sudan | 34.2 /100 | #183 | Fair 85.5% |
| Immigrants | Oceania | 33.6 /100 | #184 | Fair 85.5% |
| Spanish | 32.8 /100 | #185 | Fair 85.4% |
| Spaniards | 31.9 /100 | #186 | Fair 85.4% |
| Immigrants | Afghanistan | 29.8 /100 | #187 | Fair 85.4% |
| Immigrants | Sierra Leone | 29.0 /100 | #188 | Fair 85.4% |
| Guamanians/Chamorros | 28.4 /100 | #189 | Fair 85.3% |
| Alaskan Athabascans | 27.5 /100 | #190 | Fair 85.3% |
| South American Indians | 22.8 /100 | #191 | Fair 85.2% |
| Immigrants | Nonimmigrants | 22.7 /100 | #192 | Fair 85.2% |
| Delaware | 22.2 /100 | #193 | Fair 85.2% |
| Puget Sound Salish | 20.8 /100 | #194 | Fair 85.2% |
| Chippewa | 20.8 /100 | #195 | Fair 85.2% |
| Tongans | 20.7 /100 | #196 | Fair 85.2% |
| Costa Ricans | 20.4 /100 | #197 | Fair 85.2% |
Demographics Similar to Immigrants from Yemen by GED/Equivalency
In terms of ged/equivalency, the demographic groups most similar to Immigrants from Yemen are Immigrants from Guatemala (77.9%, a difference of 0.020%), Immigrants from Dominican Republic (78.0%, a difference of 0.060%), Immigrants from El Salvador (77.6%, a difference of 0.41%), Tohono O'odham (77.5%, a difference of 0.56%), and Mexican (77.4%, a difference of 0.65%).
| Demographics | Rating | Rank | GED/Equivalency |
| Immigrants | Cabo Verde | 0.0 /100 | #330 | Tragic 78.9% |
| Immigrants | Honduras | 0.0 /100 | #331 | Tragic 78.7% |
| Immigrants | Azores | 0.0 /100 | #332 | Tragic 78.7% |
| Salvadorans | 0.0 /100 | #333 | Tragic 78.6% |
| Guatemalans | 0.0 /100 | #334 | Tragic 78.5% |
| Immigrants | Latin America | 0.0 /100 | #335 | Tragic 78.5% |
| Immigrants | Dominican Republic | 0.0 /100 | #336 | Tragic 78.0% |
| Immigrants | Yemen | 0.0 /100 | #337 | Tragic 77.9% |
| Immigrants | Guatemala | 0.0 /100 | #338 | Tragic 77.9% |
| Immigrants | El Salvador | 0.0 /100 | #339 | Tragic 77.6% |
| Tohono O'odham | 0.0 /100 | #340 | Tragic 77.5% |
| Mexicans | 0.0 /100 | #341 | Tragic 77.4% |
| Pima | 0.0 /100 | #342 | Tragic 76.4% |
| Immigrants | Central America | 0.0 /100 | #343 | Tragic 76.4% |
| Spanish American Indians | 0.0 /100 | #344 | Tragic 76.3% |