Alaskan Athabascan vs Marshallese GED/Equivalency
COMPARE
Alaskan Athabascan
Marshallese
GED/Equivalency
GED/Equivalency Comparison
Alaskan Athabascans
Marshallese
85.3%
GED/EQUIVALENCY
27.5/ 100
METRIC RATING
190th/ 347
METRIC RANK
84.9%
GED/EQUIVALENCY
12.5/ 100
METRIC RATING
208th/ 347
METRIC RANK
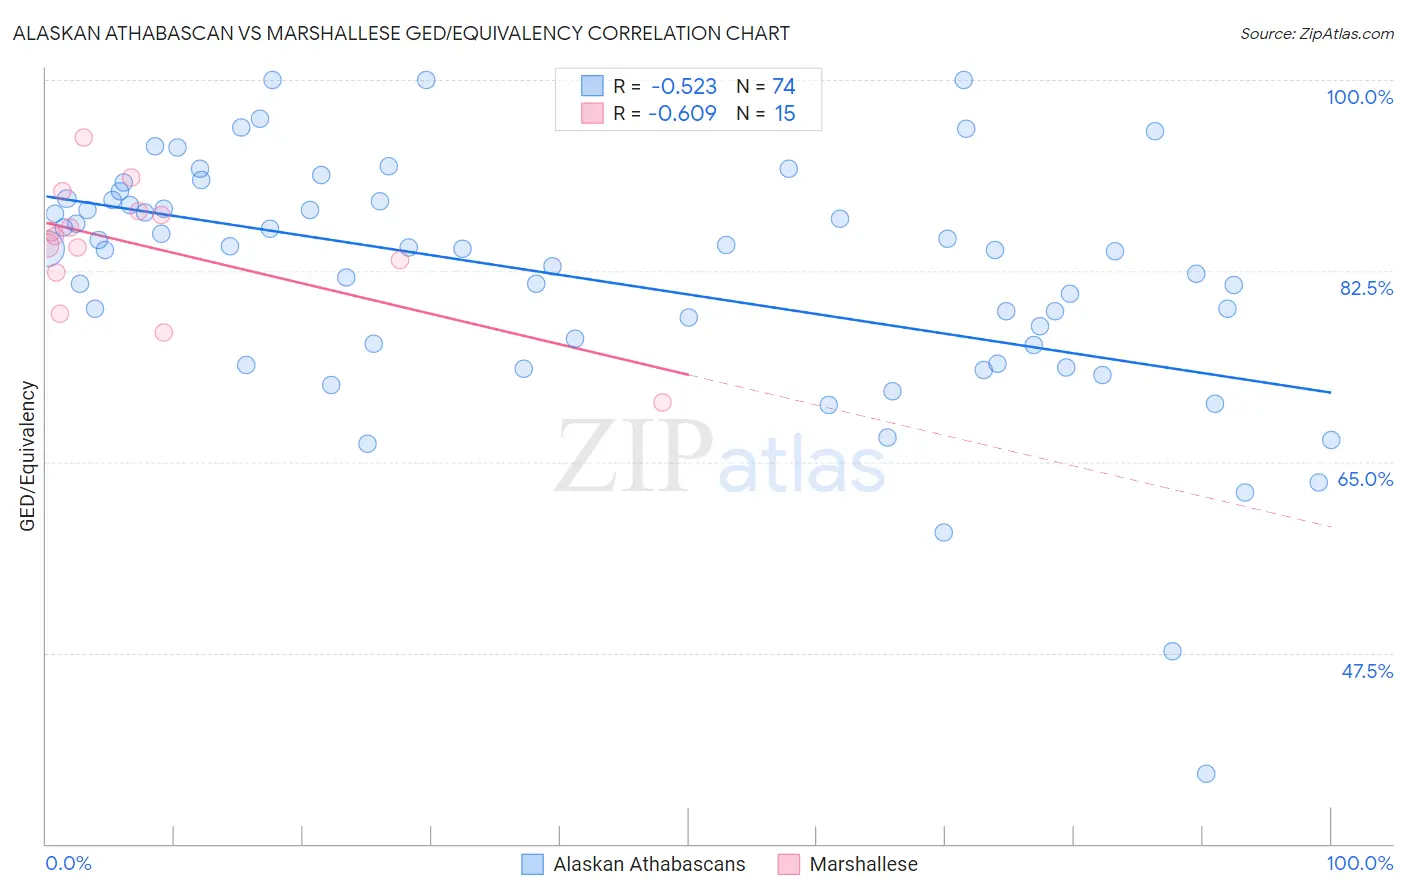
Alaskan Athabascan vs Marshallese GED/Equivalency Correlation Chart
The statistical analysis conducted on geographies consisting of 45,820,221 people shows a substantial negative correlation between the proportion of Alaskan Athabascans and percentage of population with at least ged/equivalency education in the United States with a correlation coefficient (R) of -0.523 and weighted average of 85.3%. Similarly, the statistical analysis conducted on geographies consisting of 14,760,991 people shows a significant negative correlation between the proportion of Marshallese and percentage of population with at least ged/equivalency education in the United States with a correlation coefficient (R) of -0.609 and weighted average of 84.9%, a difference of 0.51%.
GED/Equivalency Correlation Summary
| Measurement | Alaskan Athabascan | Marshallese |
| Minimum | 36.4% | 70.4% |
| Maximum | 100.0% | 94.8% |
| Range | 63.6% | 24.4% |
| Mean | 81.7% | 84.7% |
| Median | 84.5% | 85.7% |
| Interquartile 25% (IQ1) | 75.7% | 82.3% |
| Interquartile 75% (IQ3) | 88.9% | 88.0% |
| Interquartile Range (IQR) | 13.2% | 5.6% |
| Standard Deviation (Sample) | 11.4% | 6.0% |
| Standard Deviation (Population) | 11.3% | 5.8% |
Demographics Similar to Alaskan Athabascans and Marshallese by GED/Equivalency
In terms of ged/equivalency, the demographic groups most similar to Alaskan Athabascans are Guamanian/Chamorro (85.3%, a difference of 0.020%), South American Indian (85.2%, a difference of 0.13%), Nonimmigrants (85.2%, a difference of 0.13%), Delaware (85.2%, a difference of 0.15%), and Puget Sound Salish (85.2%, a difference of 0.19%). Similarly, the demographic groups most similar to Marshallese are Colombian (84.9%, a difference of 0.010%), Hmong (84.9%, a difference of 0.030%), Samoan (84.9%, a difference of 0.050%), Liberian (85.0%, a difference of 0.090%), and Panamanian (85.0%, a difference of 0.12%).
| Demographics | Rating | Rank | GED/Equivalency |
| Guamanians/Chamorros | 28.4 /100 | #189 | Fair 85.3% |
| Alaskan Athabascans | 27.5 /100 | #190 | Fair 85.3% |
| South American Indians | 22.8 /100 | #191 | Fair 85.2% |
| Immigrants | Nonimmigrants | 22.7 /100 | #192 | Fair 85.2% |
| Delaware | 22.2 /100 | #193 | Fair 85.2% |
| Puget Sound Salish | 20.8 /100 | #194 | Fair 85.2% |
| Chippewa | 20.8 /100 | #195 | Fair 85.2% |
| Tongans | 20.7 /100 | #196 | Fair 85.2% |
| Costa Ricans | 20.4 /100 | #197 | Fair 85.2% |
| Immigrants | Africa | 17.5 /100 | #198 | Poor 85.1% |
| Somalis | 16.4 /100 | #199 | Poor 85.0% |
| Uruguayans | 16.0 /100 | #200 | Poor 85.0% |
| Portuguese | 15.9 /100 | #201 | Poor 85.0% |
| Cree | 15.9 /100 | #202 | Poor 85.0% |
| Panamanians | 15.3 /100 | #203 | Poor 85.0% |
| Hawaiians | 15.2 /100 | #204 | Poor 85.0% |
| Liberians | 14.6 /100 | #205 | Poor 85.0% |
| Samoans | 13.7 /100 | #206 | Poor 84.9% |
| Hmong | 13.1 /100 | #207 | Poor 84.9% |
| Marshallese | 12.5 /100 | #208 | Poor 84.9% |
| Colombians | 12.3 /100 | #209 | Poor 84.9% |