Alaskan Athabascan vs West Indian GED/Equivalency
COMPARE
Alaskan Athabascan
West Indian
GED/Equivalency
GED/Equivalency Comparison
Alaskan Athabascans
West Indians
85.3%
GED/EQUIVALENCY
27.5/ 100
METRIC RATING
190th/ 347
METRIC RANK
83.1%
GED/EQUIVALENCY
0.2/ 100
METRIC RATING
265th/ 347
METRIC RANK
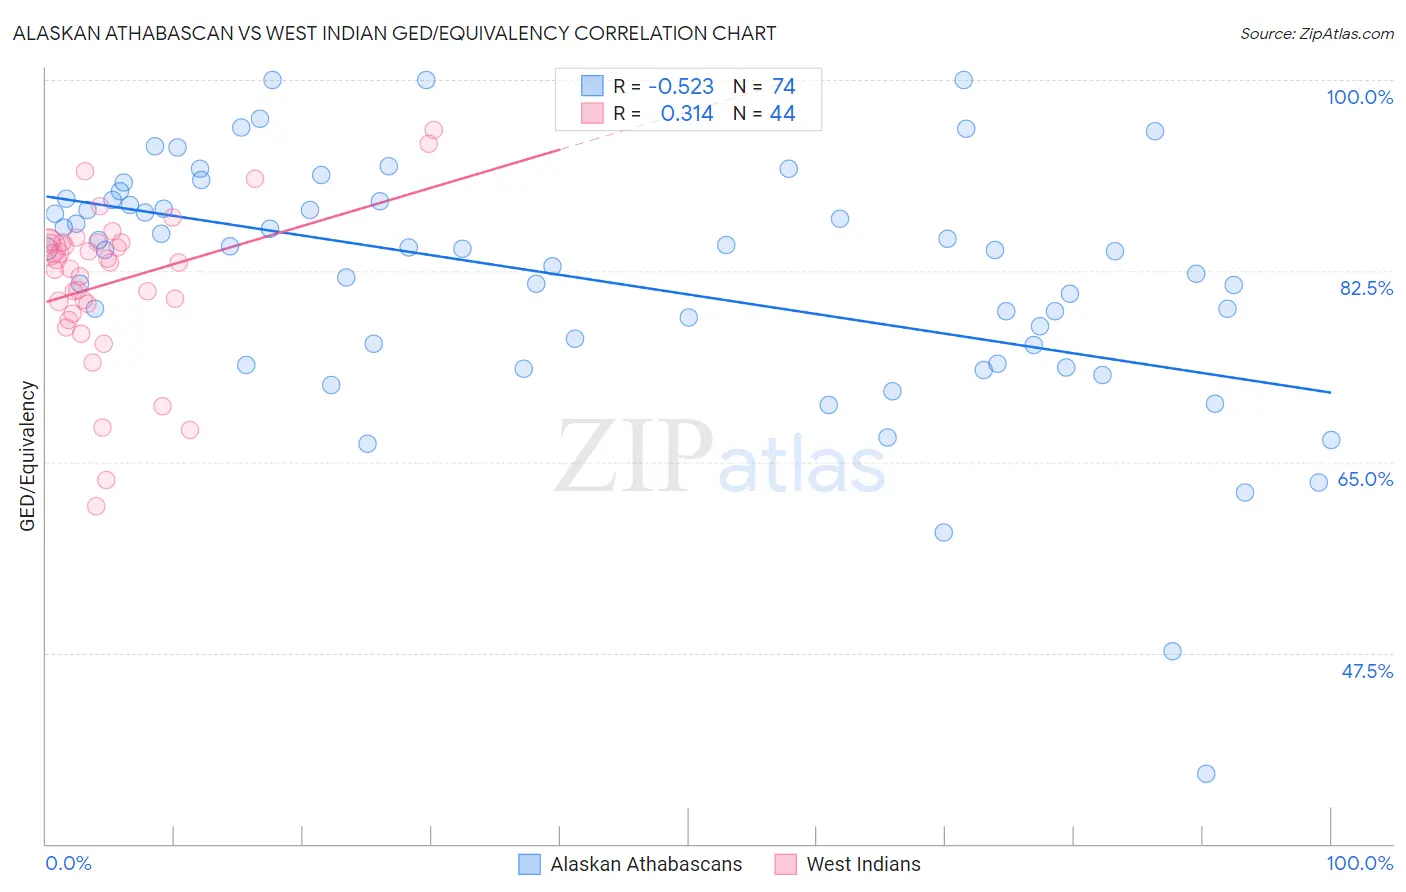
Alaskan Athabascan vs West Indian GED/Equivalency Correlation Chart
The statistical analysis conducted on geographies consisting of 45,820,221 people shows a substantial negative correlation between the proportion of Alaskan Athabascans and percentage of population with at least ged/equivalency education in the United States with a correlation coefficient (R) of -0.523 and weighted average of 85.3%. Similarly, the statistical analysis conducted on geographies consisting of 254,063,654 people shows a mild positive correlation between the proportion of West Indians and percentage of population with at least ged/equivalency education in the United States with a correlation coefficient (R) of 0.314 and weighted average of 83.1%, a difference of 2.7%.
GED/Equivalency Correlation Summary
| Measurement | Alaskan Athabascan | West Indian |
| Minimum | 36.4% | 61.0% |
| Maximum | 100.0% | 95.4% |
| Range | 63.6% | 34.5% |
| Mean | 81.7% | 81.5% |
| Median | 84.5% | 83.3% |
| Interquartile 25% (IQ1) | 75.7% | 79.0% |
| Interquartile 75% (IQ3) | 88.9% | 85.1% |
| Interquartile Range (IQR) | 13.2% | 6.1% |
| Standard Deviation (Sample) | 11.4% | 7.2% |
| Standard Deviation (Population) | 11.3% | 7.1% |
Similar Demographics by GED/Equivalency
Demographics Similar to Alaskan Athabascans by GED/Equivalency
In terms of ged/equivalency, the demographic groups most similar to Alaskan Athabascans are Guamanian/Chamorro (85.3%, a difference of 0.020%), Immigrants from Sierra Leone (85.4%, a difference of 0.040%), Immigrants from Afghanistan (85.4%, a difference of 0.060%), Spaniard (85.4%, a difference of 0.11%), and Spanish (85.4%, a difference of 0.13%).
| Demographics | Rating | Rank | GED/Equivalency |
| Immigrants | Sudan | 34.2 /100 | #183 | Fair 85.5% |
| Immigrants | Oceania | 33.6 /100 | #184 | Fair 85.5% |
| Spanish | 32.8 /100 | #185 | Fair 85.4% |
| Spaniards | 31.9 /100 | #186 | Fair 85.4% |
| Immigrants | Afghanistan | 29.8 /100 | #187 | Fair 85.4% |
| Immigrants | Sierra Leone | 29.0 /100 | #188 | Fair 85.4% |
| Guamanians/Chamorros | 28.4 /100 | #189 | Fair 85.3% |
| Alaskan Athabascans | 27.5 /100 | #190 | Fair 85.3% |
| South American Indians | 22.8 /100 | #191 | Fair 85.2% |
| Immigrants | Nonimmigrants | 22.7 /100 | #192 | Fair 85.2% |
| Delaware | 22.2 /100 | #193 | Fair 85.2% |
| Puget Sound Salish | 20.8 /100 | #194 | Fair 85.2% |
| Chippewa | 20.8 /100 | #195 | Fair 85.2% |
| Tongans | 20.7 /100 | #196 | Fair 85.2% |
| Costa Ricans | 20.4 /100 | #197 | Fair 85.2% |
Demographics Similar to West Indians by GED/Equivalency
In terms of ged/equivalency, the demographic groups most similar to West Indians are Bangladeshi (83.1%, a difference of 0.010%), Kiowa (83.1%, a difference of 0.010%), Immigrants from Congo (83.1%, a difference of 0.020%), Trinidadian and Tobagonian (83.0%, a difference of 0.020%), and Inupiat (83.1%, a difference of 0.030%).
| Demographics | Rating | Rank | GED/Equivalency |
| Malaysians | 0.4 /100 | #258 | Tragic 83.3% |
| Immigrants | Vietnam | 0.3 /100 | #259 | Tragic 83.2% |
| Choctaw | 0.3 /100 | #260 | Tragic 83.1% |
| Inupiat | 0.2 /100 | #261 | Tragic 83.1% |
| Immigrants | Armenia | 0.2 /100 | #262 | Tragic 83.1% |
| Immigrants | Congo | 0.2 /100 | #263 | Tragic 83.1% |
| Bangladeshis | 0.2 /100 | #264 | Tragic 83.1% |
| West Indians | 0.2 /100 | #265 | Tragic 83.1% |
| Kiowa | 0.2 /100 | #266 | Tragic 83.1% |
| Trinidadians and Tobagonians | 0.2 /100 | #267 | Tragic 83.0% |
| Immigrants | Burma/Myanmar | 0.2 /100 | #268 | Tragic 83.0% |
| Hopi | 0.2 /100 | #269 | Tragic 83.0% |
| Immigrants | Jamaica | 0.2 /100 | #270 | Tragic 82.9% |
| U.S. Virgin Islanders | 0.2 /100 | #271 | Tragic 82.9% |
| Barbadians | 0.1 /100 | #272 | Tragic 82.9% |