Immigrants from Japan vs Immigrants from Zaire GED/Equivalency
COMPARE
Immigrants from Japan
Immigrants from Zaire
GED/Equivalency
GED/Equivalency Comparison
Immigrants from Japan
Immigrants from Zaire
88.4%
GED/EQUIVALENCY
99.7/ 100
METRIC RATING
34th/ 347
METRIC RANK
84.5%
GED/EQUIVALENCY
5.5/ 100
METRIC RATING
226th/ 347
METRIC RANK
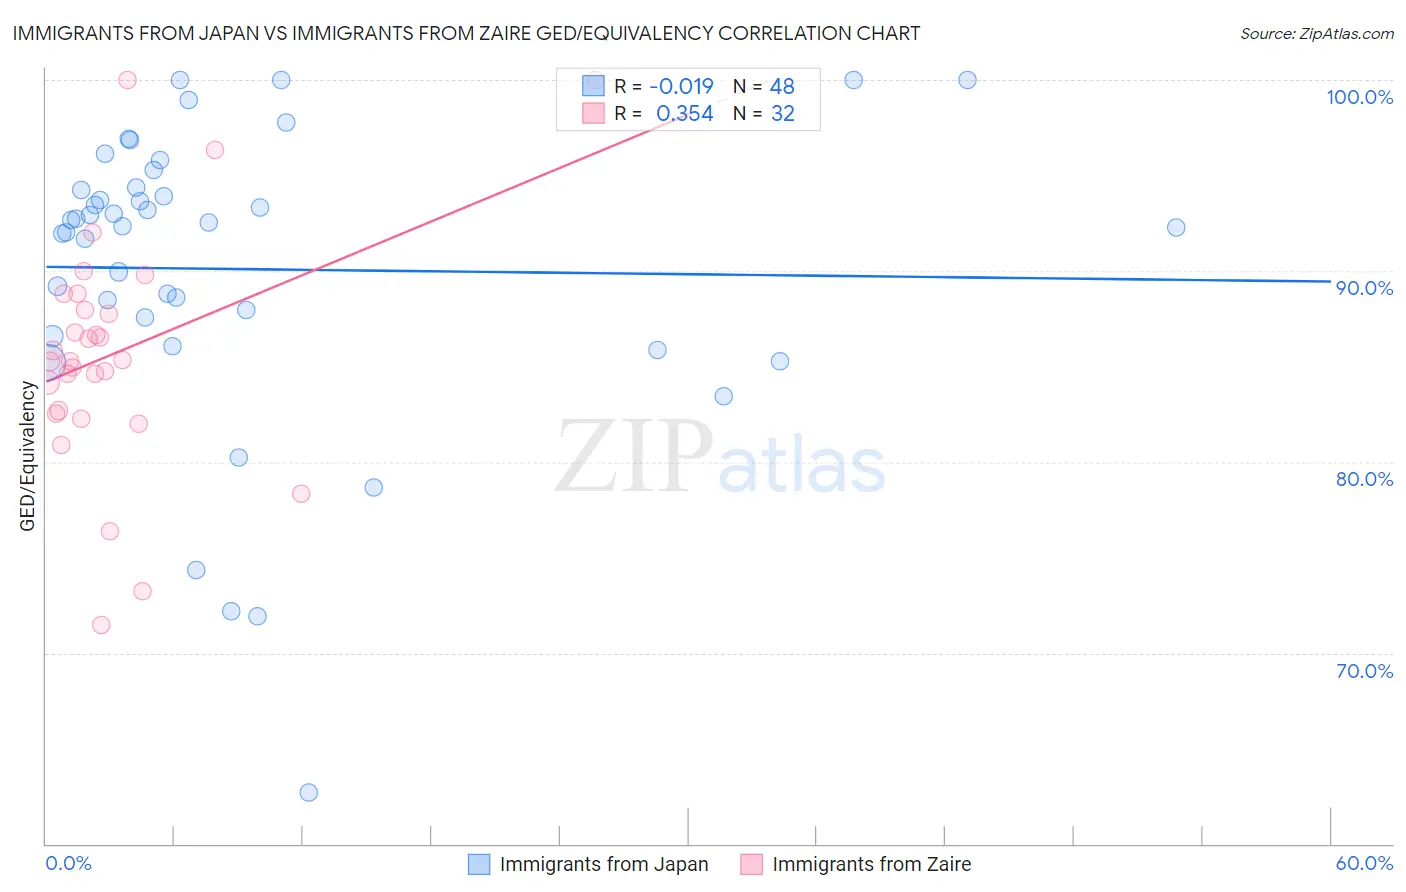
Immigrants from Japan vs Immigrants from Zaire GED/Equivalency Correlation Chart
The statistical analysis conducted on geographies consisting of 340,148,851 people shows no correlation between the proportion of Immigrants from Japan and percentage of population with at least ged/equivalency education in the United States with a correlation coefficient (R) of -0.019 and weighted average of 88.4%. Similarly, the statistical analysis conducted on geographies consisting of 107,255,805 people shows a mild positive correlation between the proportion of Immigrants from Zaire and percentage of population with at least ged/equivalency education in the United States with a correlation coefficient (R) of 0.354 and weighted average of 84.5%, a difference of 4.6%.
GED/Equivalency Correlation Summary
| Measurement | Immigrants from Japan | Immigrants from Zaire |
| Minimum | 62.7% | 71.4% |
| Maximum | 100.0% | 100.0% |
| Range | 37.3% | 28.6% |
| Mean | 90.1% | 85.7% |
| Median | 92.4% | 85.3% |
| Interquartile 25% (IQ1) | 87.1% | 82.6% |
| Interquartile 75% (IQ3) | 94.3% | 88.4% |
| Interquartile Range (IQR) | 7.2% | 5.8% |
| Standard Deviation (Sample) | 7.9% | 6.2% |
| Standard Deviation (Population) | 7.8% | 6.1% |
Similar Demographics by GED/Equivalency
Demographics Similar to Immigrants from Japan by GED/Equivalency
In terms of ged/equivalency, the demographic groups most similar to Immigrants from Japan are Immigrants from Sweden (88.4%, a difference of 0.010%), Immigrants from South Central Asia (88.4%, a difference of 0.020%), Immigrants from Belgium (88.3%, a difference of 0.040%), Danish (88.4%, a difference of 0.050%), and Bhutanese (88.4%, a difference of 0.070%).
| Demographics | Rating | Rank | GED/Equivalency |
| Immigrants | Lithuania | 99.8 /100 | #27 | Exceptional 88.6% |
| Immigrants | Northern Europe | 99.8 /100 | #28 | Exceptional 88.5% |
| Poles | 99.8 /100 | #29 | Exceptional 88.5% |
| Turks | 99.8 /100 | #30 | Exceptional 88.5% |
| Bhutanese | 99.8 /100 | #31 | Exceptional 88.4% |
| Danes | 99.8 /100 | #32 | Exceptional 88.4% |
| Immigrants | Sweden | 99.7 /100 | #33 | Exceptional 88.4% |
| Immigrants | Japan | 99.7 /100 | #34 | Exceptional 88.4% |
| Immigrants | South Central Asia | 99.7 /100 | #35 | Exceptional 88.4% |
| Immigrants | Belgium | 99.7 /100 | #36 | Exceptional 88.3% |
| Immigrants | Austria | 99.7 /100 | #37 | Exceptional 88.3% |
| Burmese | 99.7 /100 | #38 | Exceptional 88.3% |
| Immigrants | Israel | 99.6 /100 | #39 | Exceptional 88.2% |
| Italians | 99.6 /100 | #40 | Exceptional 88.2% |
| Finns | 99.6 /100 | #41 | Exceptional 88.2% |
Demographics Similar to Immigrants from Zaire by GED/Equivalency
In terms of ged/equivalency, the demographic groups most similar to Immigrants from Zaire are Immigrants from Costa Rica (84.5%, a difference of 0.010%), Immigrants from Thailand (84.5%, a difference of 0.020%), Immigrants from Liberia (84.4%, a difference of 0.070%), French American Indian (84.6%, a difference of 0.080%), and Immigrants from Uruguay (84.4%, a difference of 0.10%).
| Demographics | Rating | Rank | GED/Equivalency |
| Potawatomi | 8.2 /100 | #219 | Tragic 84.7% |
| Americans | 8.2 /100 | #220 | Tragic 84.7% |
| Taiwanese | 8.1 /100 | #221 | Tragic 84.7% |
| Iroquois | 7.5 /100 | #222 | Tragic 84.6% |
| Immigrants | Uzbekistan | 7.1 /100 | #223 | Tragic 84.6% |
| French American Indians | 6.3 /100 | #224 | Tragic 84.6% |
| Immigrants | Thailand | 5.8 /100 | #225 | Tragic 84.5% |
| Immigrants | Zaire | 5.5 /100 | #226 | Tragic 84.5% |
| Immigrants | Costa Rica | 5.4 /100 | #227 | Tragic 84.5% |
| Immigrants | Liberia | 4.9 /100 | #228 | Tragic 84.4% |
| Immigrants | Uruguay | 4.6 /100 | #229 | Tragic 84.4% |
| Immigrants | Colombia | 4.5 /100 | #230 | Tragic 84.4% |
| Immigrants | Middle Africa | 4.3 /100 | #231 | Tragic 84.4% |
| Immigrants | South America | 4.2 /100 | #232 | Tragic 84.4% |
| Immigrants | Panama | 4.1 /100 | #233 | Tragic 84.4% |