Alaskan Athabascan vs Somali GED/Equivalency
COMPARE
Alaskan Athabascan
Somali
GED/Equivalency
GED/Equivalency Comparison
Alaskan Athabascans
Somalis
85.3%
GED/EQUIVALENCY
27.5/ 100
METRIC RATING
190th/ 347
METRIC RANK
85.0%
GED/EQUIVALENCY
16.4/ 100
METRIC RATING
199th/ 347
METRIC RANK
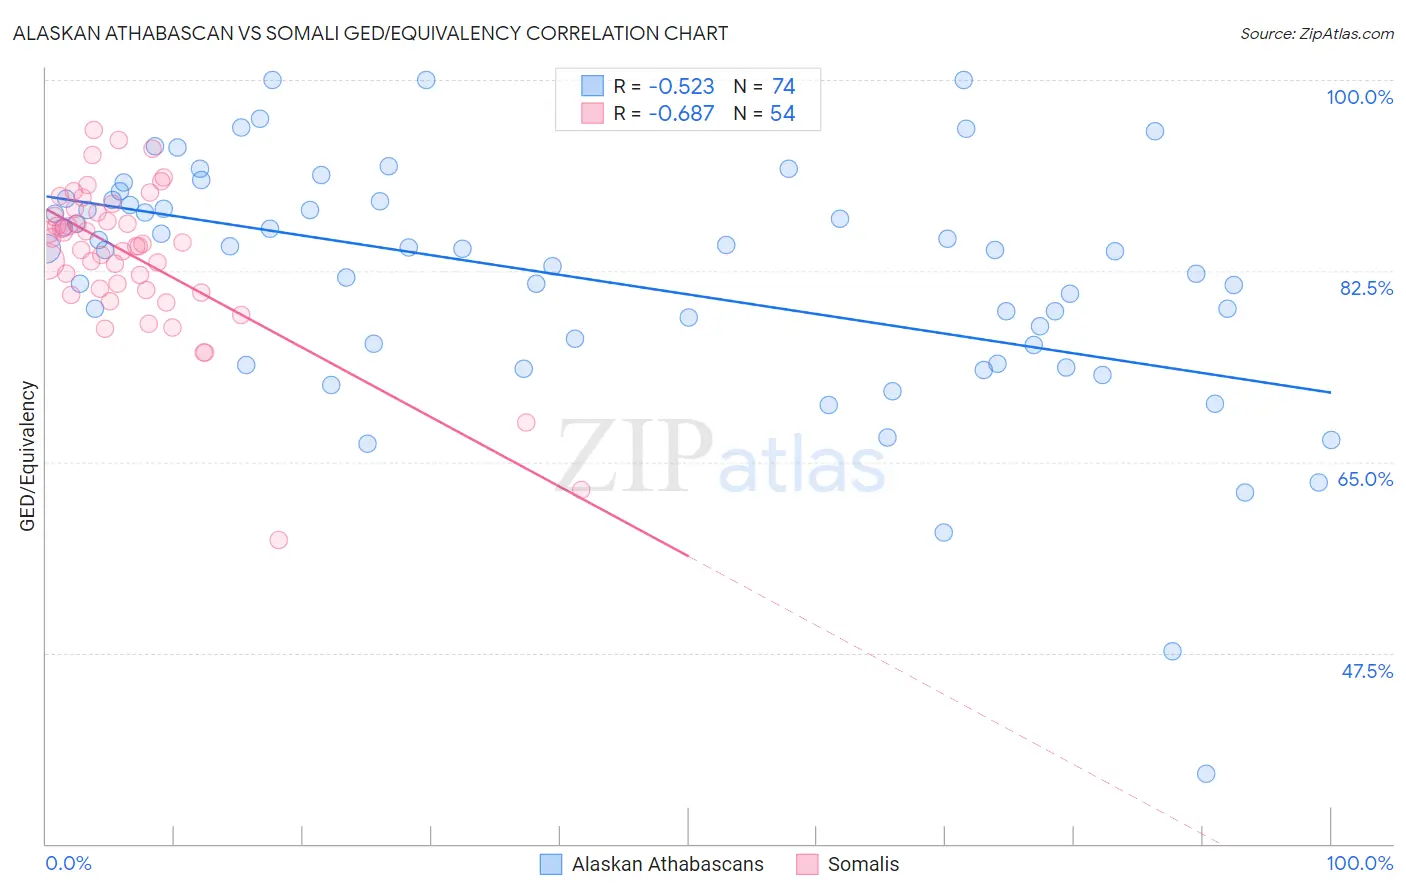
Alaskan Athabascan vs Somali GED/Equivalency Correlation Chart
The statistical analysis conducted on geographies consisting of 45,820,221 people shows a substantial negative correlation between the proportion of Alaskan Athabascans and percentage of population with at least ged/equivalency education in the United States with a correlation coefficient (R) of -0.523 and weighted average of 85.3%. Similarly, the statistical analysis conducted on geographies consisting of 99,332,457 people shows a significant negative correlation between the proportion of Somalis and percentage of population with at least ged/equivalency education in the United States with a correlation coefficient (R) of -0.687 and weighted average of 85.0%, a difference of 0.34%.
GED/Equivalency Correlation Summary
| Measurement | Alaskan Athabascan | Somali |
| Minimum | 36.4% | 57.9% |
| Maximum | 100.0% | 95.4% |
| Range | 63.6% | 37.5% |
| Mean | 81.7% | 83.8% |
| Median | 84.5% | 84.9% |
| Interquartile 25% (IQ1) | 75.7% | 80.8% |
| Interquartile 75% (IQ3) | 88.9% | 87.9% |
| Interquartile Range (IQR) | 13.2% | 7.1% |
| Standard Deviation (Sample) | 11.4% | 7.0% |
| Standard Deviation (Population) | 11.3% | 7.0% |
Demographics Similar to Alaskan Athabascans and Somalis by GED/Equivalency
In terms of ged/equivalency, the demographic groups most similar to Alaskan Athabascans are Guamanian/Chamorro (85.3%, a difference of 0.020%), Immigrants from Sierra Leone (85.4%, a difference of 0.040%), Immigrants from Afghanistan (85.4%, a difference of 0.060%), Spaniard (85.4%, a difference of 0.11%), and Spanish (85.4%, a difference of 0.13%). Similarly, the demographic groups most similar to Somalis are Uruguayan (85.0%, a difference of 0.010%), Portuguese (85.0%, a difference of 0.020%), Cree (85.0%, a difference of 0.020%), Immigrants from Africa (85.1%, a difference of 0.040%), and Panamanian (85.0%, a difference of 0.040%).
| Demographics | Rating | Rank | GED/Equivalency |
| Immigrants | Oceania | 33.6 /100 | #184 | Fair 85.5% |
| Spanish | 32.8 /100 | #185 | Fair 85.4% |
| Spaniards | 31.9 /100 | #186 | Fair 85.4% |
| Immigrants | Afghanistan | 29.8 /100 | #187 | Fair 85.4% |
| Immigrants | Sierra Leone | 29.0 /100 | #188 | Fair 85.4% |
| Guamanians/Chamorros | 28.4 /100 | #189 | Fair 85.3% |
| Alaskan Athabascans | 27.5 /100 | #190 | Fair 85.3% |
| South American Indians | 22.8 /100 | #191 | Fair 85.2% |
| Immigrants | Nonimmigrants | 22.7 /100 | #192 | Fair 85.2% |
| Delaware | 22.2 /100 | #193 | Fair 85.2% |
| Puget Sound Salish | 20.8 /100 | #194 | Fair 85.2% |
| Chippewa | 20.8 /100 | #195 | Fair 85.2% |
| Tongans | 20.7 /100 | #196 | Fair 85.2% |
| Costa Ricans | 20.4 /100 | #197 | Fair 85.2% |
| Immigrants | Africa | 17.5 /100 | #198 | Poor 85.1% |
| Somalis | 16.4 /100 | #199 | Poor 85.0% |
| Uruguayans | 16.0 /100 | #200 | Poor 85.0% |
| Portuguese | 15.9 /100 | #201 | Poor 85.0% |
| Cree | 15.9 /100 | #202 | Poor 85.0% |
| Panamanians | 15.3 /100 | #203 | Poor 85.0% |
| Hawaiians | 15.2 /100 | #204 | Poor 85.0% |