Yaqui vs Arab Self-Care Disability
COMPARE
Yaqui
Arab
Self-Care Disability
Self-Care Disability Comparison
Yaqui
Arabs
2.7%
SELF-CARE DISABILITY
0.1/ 100
METRIC RATING
267th/ 347
METRIC RANK
2.4%
SELF-CARE DISABILITY
75.7/ 100
METRIC RATING
149th/ 347
METRIC RANK
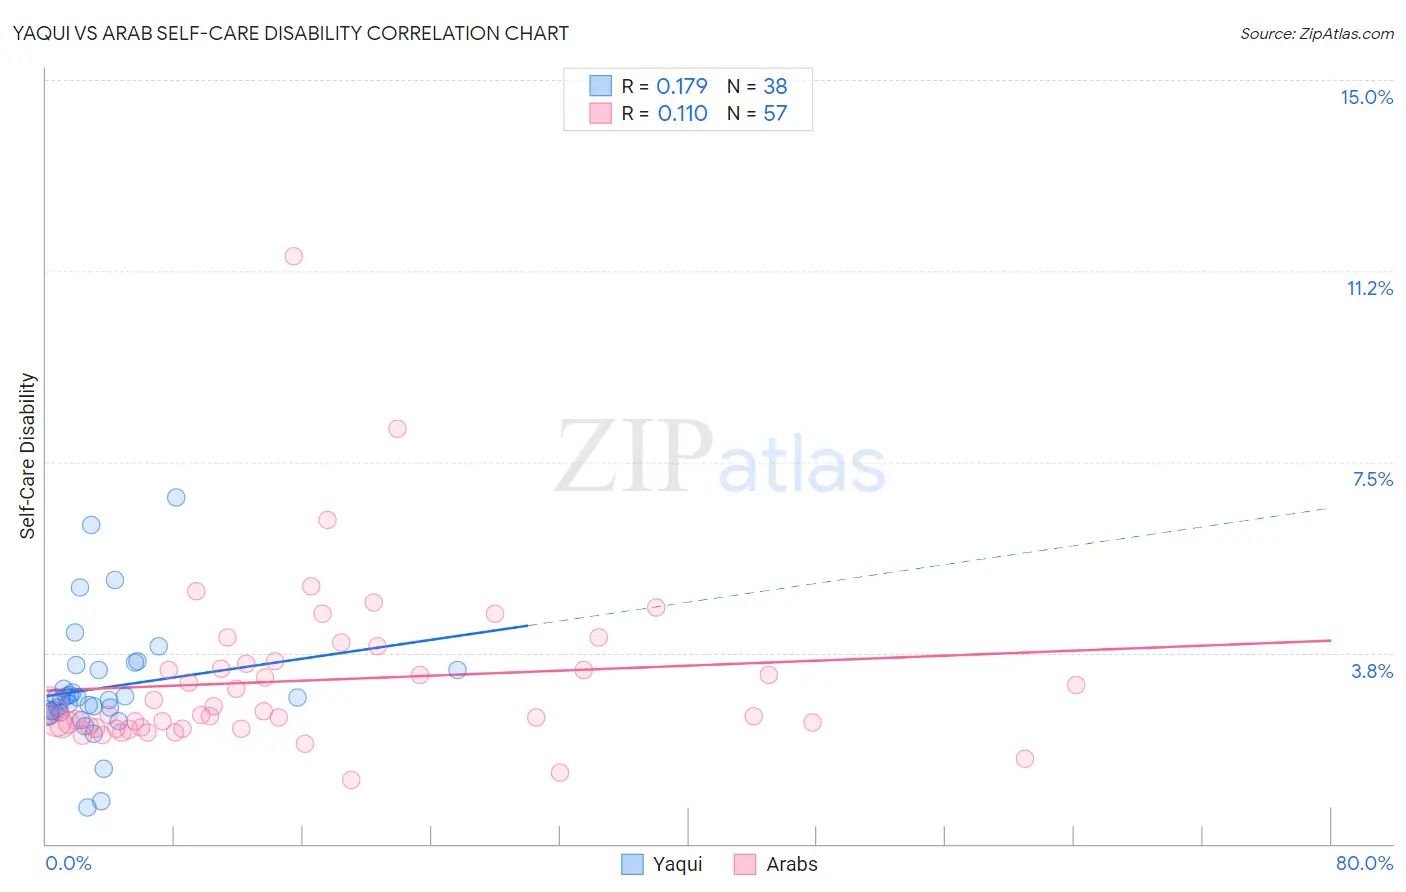
Yaqui vs Arab Self-Care Disability Correlation Chart
The statistical analysis conducted on geographies consisting of 107,691,842 people shows a poor positive correlation between the proportion of Yaqui and percentage of population with self-care disability in the United States with a correlation coefficient (R) of 0.179 and weighted average of 2.7%. Similarly, the statistical analysis conducted on geographies consisting of 485,999,863 people shows a poor positive correlation between the proportion of Arabs and percentage of population with self-care disability in the United States with a correlation coefficient (R) of 0.110 and weighted average of 2.4%, a difference of 9.5%.
Self-Care Disability Correlation Summary
| Measurement | Yaqui | Arab |
| Minimum | 0.71% | 1.3% |
| Maximum | 6.8% | 11.5% |
| Range | 6.1% | 10.3% |
| Mean | 3.1% | 3.2% |
| Median | 2.8% | 2.5% |
| Interquartile 25% (IQ1) | 2.6% | 2.3% |
| Interquartile 75% (IQ3) | 3.4% | 3.6% |
| Interquartile Range (IQR) | 0.82% | 1.3% |
| Standard Deviation (Sample) | 1.2% | 1.6% |
| Standard Deviation (Population) | 1.2% | 1.6% |
Similar Demographics by Self-Care Disability
Demographics Similar to Yaqui by Self-Care Disability
In terms of self-care disability, the demographic groups most similar to Yaqui are Immigrants from Mexico (2.7%, a difference of 0.050%), Immigrants from Cambodia (2.7%, a difference of 0.19%), U.S. Virgin Islander (2.7%, a difference of 0.22%), Immigrants from Nicaragua (2.7%, a difference of 0.25%), and Immigrants from Micronesia (2.7%, a difference of 0.25%).
| Demographics | Rating | Rank | Self-Care Disability |
| Chippewa | 0.2 /100 | #260 | Tragic 2.6% |
| Arapaho | 0.2 /100 | #261 | Tragic 2.6% |
| Shoshone | 0.2 /100 | #262 | Tragic 2.7% |
| Immigrants | Latin America | 0.2 /100 | #263 | Tragic 2.7% |
| Immigrants | Iran | 0.2 /100 | #264 | Tragic 2.7% |
| Immigrants | Nicaragua | 0.2 /100 | #265 | Tragic 2.7% |
| Immigrants | Cambodia | 0.1 /100 | #266 | Tragic 2.7% |
| Yaqui | 0.1 /100 | #267 | Tragic 2.7% |
| Immigrants | Mexico | 0.1 /100 | #268 | Tragic 2.7% |
| U.S. Virgin Islanders | 0.1 /100 | #269 | Tragic 2.7% |
| Immigrants | Micronesia | 0.1 /100 | #270 | Tragic 2.7% |
| Trinidadians and Tobagonians | 0.1 /100 | #271 | Tragic 2.7% |
| Immigrants | Laos | 0.1 /100 | #272 | Tragic 2.7% |
| Mexicans | 0.1 /100 | #273 | Tragic 2.7% |
| Yakama | 0.1 /100 | #274 | Tragic 2.7% |
Demographics Similar to Arabs by Self-Care Disability
In terms of self-care disability, the demographic groups most similar to Arabs are Romanian (2.4%, a difference of 0.010%), Immigrants from Costa Rica (2.4%, a difference of 0.040%), Basque (2.4%, a difference of 0.11%), Dutch (2.4%, a difference of 0.12%), and Tlingit-Haida (2.4%, a difference of 0.14%).
| Demographics | Rating | Rank | Self-Care Disability |
| Immigrants | Peru | 83.2 /100 | #142 | Excellent 2.4% |
| Afghans | 82.3 /100 | #143 | Excellent 2.4% |
| Costa Ricans | 80.8 /100 | #144 | Excellent 2.4% |
| Germans | 80.1 /100 | #145 | Excellent 2.4% |
| Israelis | 80.0 /100 | #146 | Good 2.4% |
| Dutch | 77.5 /100 | #147 | Good 2.4% |
| Romanians | 75.8 /100 | #148 | Good 2.4% |
| Arabs | 75.7 /100 | #149 | Good 2.4% |
| Immigrants | Costa Rica | 75.1 /100 | #150 | Good 2.4% |
| Basques | 74.0 /100 | #151 | Good 2.4% |
| Tlingit-Haida | 73.5 /100 | #152 | Good 2.4% |
| Immigrants | England | 73.5 /100 | #153 | Good 2.4% |
| Italians | 72.2 /100 | #154 | Good 2.4% |
| Pakistanis | 71.4 /100 | #155 | Good 2.4% |
| Nigerians | 70.6 /100 | #156 | Good 2.4% |