Immigrants from Zimbabwe vs Arab Self-Care Disability
COMPARE
Immigrants from Zimbabwe
Arab
Self-Care Disability
Self-Care Disability Comparison
Immigrants from Zimbabwe
Arabs
2.3%
SELF-CARE DISABILITY
99.9/ 100
METRIC RATING
29th/ 347
METRIC RANK
2.4%
SELF-CARE DISABILITY
75.7/ 100
METRIC RATING
149th/ 347
METRIC RANK
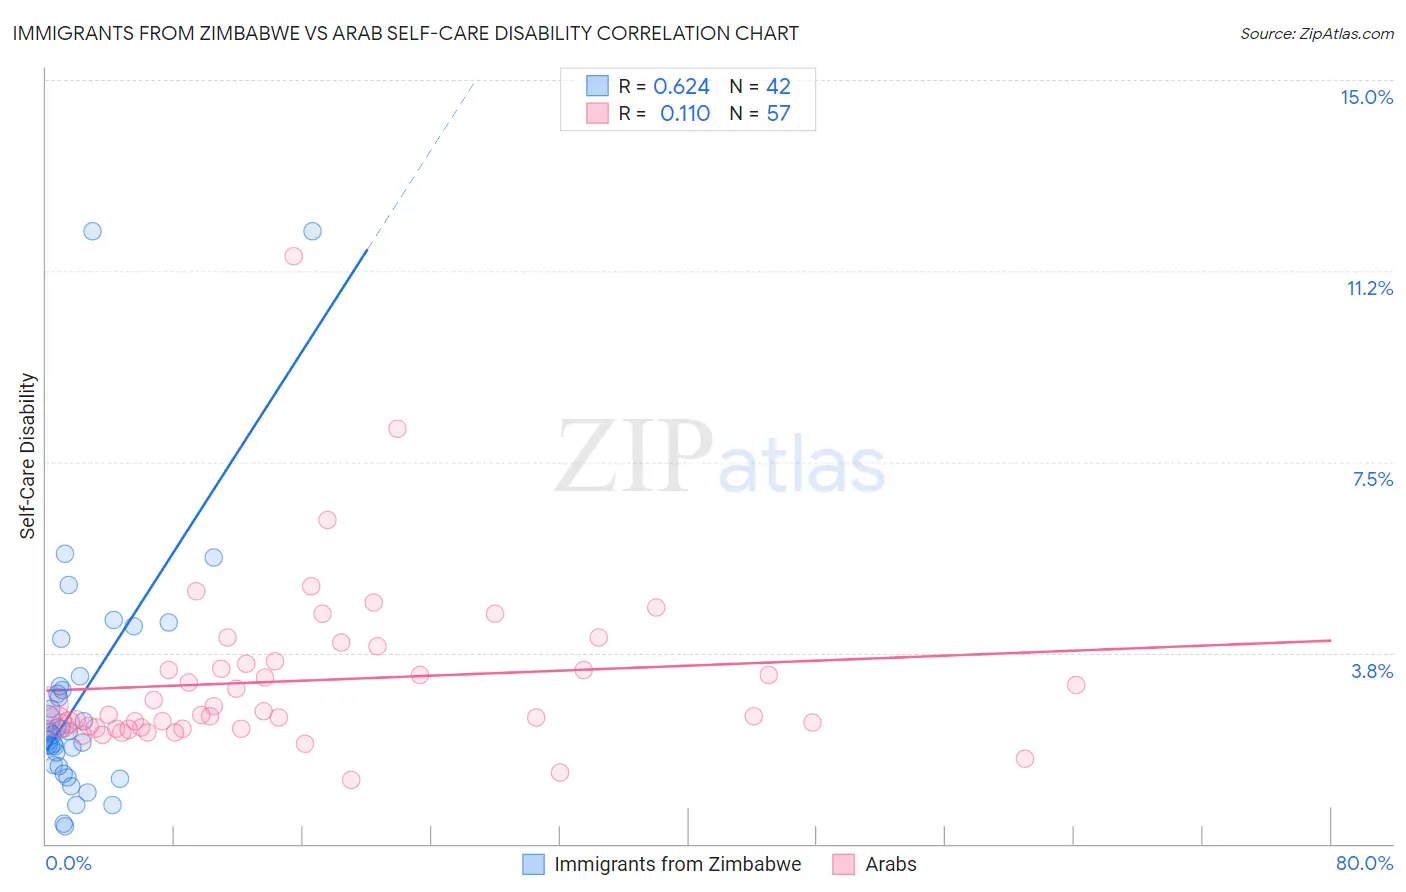
Immigrants from Zimbabwe vs Arab Self-Care Disability Correlation Chart
The statistical analysis conducted on geographies consisting of 117,788,572 people shows a significant positive correlation between the proportion of Immigrants from Zimbabwe and percentage of population with self-care disability in the United States with a correlation coefficient (R) of 0.624 and weighted average of 2.3%. Similarly, the statistical analysis conducted on geographies consisting of 485,999,863 people shows a poor positive correlation between the proportion of Arabs and percentage of population with self-care disability in the United States with a correlation coefficient (R) of 0.110 and weighted average of 2.4%, a difference of 8.1%.
Self-Care Disability Correlation Summary
| Measurement | Immigrants from Zimbabwe | Arab |
| Minimum | 0.34% | 1.3% |
| Maximum | 12.0% | 11.5% |
| Range | 11.7% | 10.3% |
| Mean | 2.9% | 3.2% |
| Median | 2.2% | 2.5% |
| Interquartile 25% (IQ1) | 1.6% | 2.3% |
| Interquartile 75% (IQ3) | 3.1% | 3.6% |
| Interquartile Range (IQR) | 1.5% | 1.3% |
| Standard Deviation (Sample) | 2.4% | 1.6% |
| Standard Deviation (Population) | 2.4% | 1.6% |
Similar Demographics by Self-Care Disability
Demographics Similar to Immigrants from Zimbabwe by Self-Care Disability
In terms of self-care disability, the demographic groups most similar to Immigrants from Zimbabwe are Inupiat (2.2%, a difference of 0.090%), Venezuelan (2.2%, a difference of 0.25%), Immigrants from Sri Lanka (2.2%, a difference of 0.26%), Turkish (2.2%, a difference of 0.33%), and Paraguayan (2.3%, a difference of 0.33%).
| Demographics | Rating | Rank | Self-Care Disability |
| Immigrants | Venezuela | 100.0 /100 | #22 | Exceptional 2.2% |
| Cambodians | 100.0 /100 | #23 | Exceptional 2.2% |
| Cypriots | 100.0 /100 | #24 | Exceptional 2.2% |
| Turks | 100.0 /100 | #25 | Exceptional 2.2% |
| Immigrants | Sri Lanka | 99.9 /100 | #26 | Exceptional 2.2% |
| Venezuelans | 99.9 /100 | #27 | Exceptional 2.2% |
| Inupiat | 99.9 /100 | #28 | Exceptional 2.2% |
| Immigrants | Zimbabwe | 99.9 /100 | #29 | Exceptional 2.3% |
| Paraguayans | 99.9 /100 | #30 | Exceptional 2.3% |
| Danes | 99.9 /100 | #31 | Exceptional 2.3% |
| Burmese | 99.9 /100 | #32 | Exceptional 2.3% |
| Immigrants | Korea | 99.9 /100 | #33 | Exceptional 2.3% |
| Immigrants | Turkey | 99.9 /100 | #34 | Exceptional 2.3% |
| Immigrants | Australia | 99.9 /100 | #35 | Exceptional 2.3% |
| Immigrants | Lithuania | 99.9 /100 | #36 | Exceptional 2.3% |
Demographics Similar to Arabs by Self-Care Disability
In terms of self-care disability, the demographic groups most similar to Arabs are Romanian (2.4%, a difference of 0.010%), Immigrants from Costa Rica (2.4%, a difference of 0.040%), Basque (2.4%, a difference of 0.11%), Dutch (2.4%, a difference of 0.12%), and Tlingit-Haida (2.4%, a difference of 0.14%).
| Demographics | Rating | Rank | Self-Care Disability |
| Immigrants | Peru | 83.2 /100 | #142 | Excellent 2.4% |
| Afghans | 82.3 /100 | #143 | Excellent 2.4% |
| Costa Ricans | 80.8 /100 | #144 | Excellent 2.4% |
| Germans | 80.1 /100 | #145 | Excellent 2.4% |
| Israelis | 80.0 /100 | #146 | Good 2.4% |
| Dutch | 77.5 /100 | #147 | Good 2.4% |
| Romanians | 75.8 /100 | #148 | Good 2.4% |
| Arabs | 75.7 /100 | #149 | Good 2.4% |
| Immigrants | Costa Rica | 75.1 /100 | #150 | Good 2.4% |
| Basques | 74.0 /100 | #151 | Good 2.4% |
| Tlingit-Haida | 73.5 /100 | #152 | Good 2.4% |
| Immigrants | England | 73.5 /100 | #153 | Good 2.4% |
| Italians | 72.2 /100 | #154 | Good 2.4% |
| Pakistanis | 71.4 /100 | #155 | Good 2.4% |
| Nigerians | 70.6 /100 | #156 | Good 2.4% |