Yaqui vs Paraguayan Self-Care Disability
COMPARE
Yaqui
Paraguayan
Self-Care Disability
Self-Care Disability Comparison
Yaqui
Paraguayans
2.7%
SELF-CARE DISABILITY
0.1/ 100
METRIC RATING
267th/ 347
METRIC RANK
2.3%
SELF-CARE DISABILITY
99.9/ 100
METRIC RATING
30th/ 347
METRIC RANK
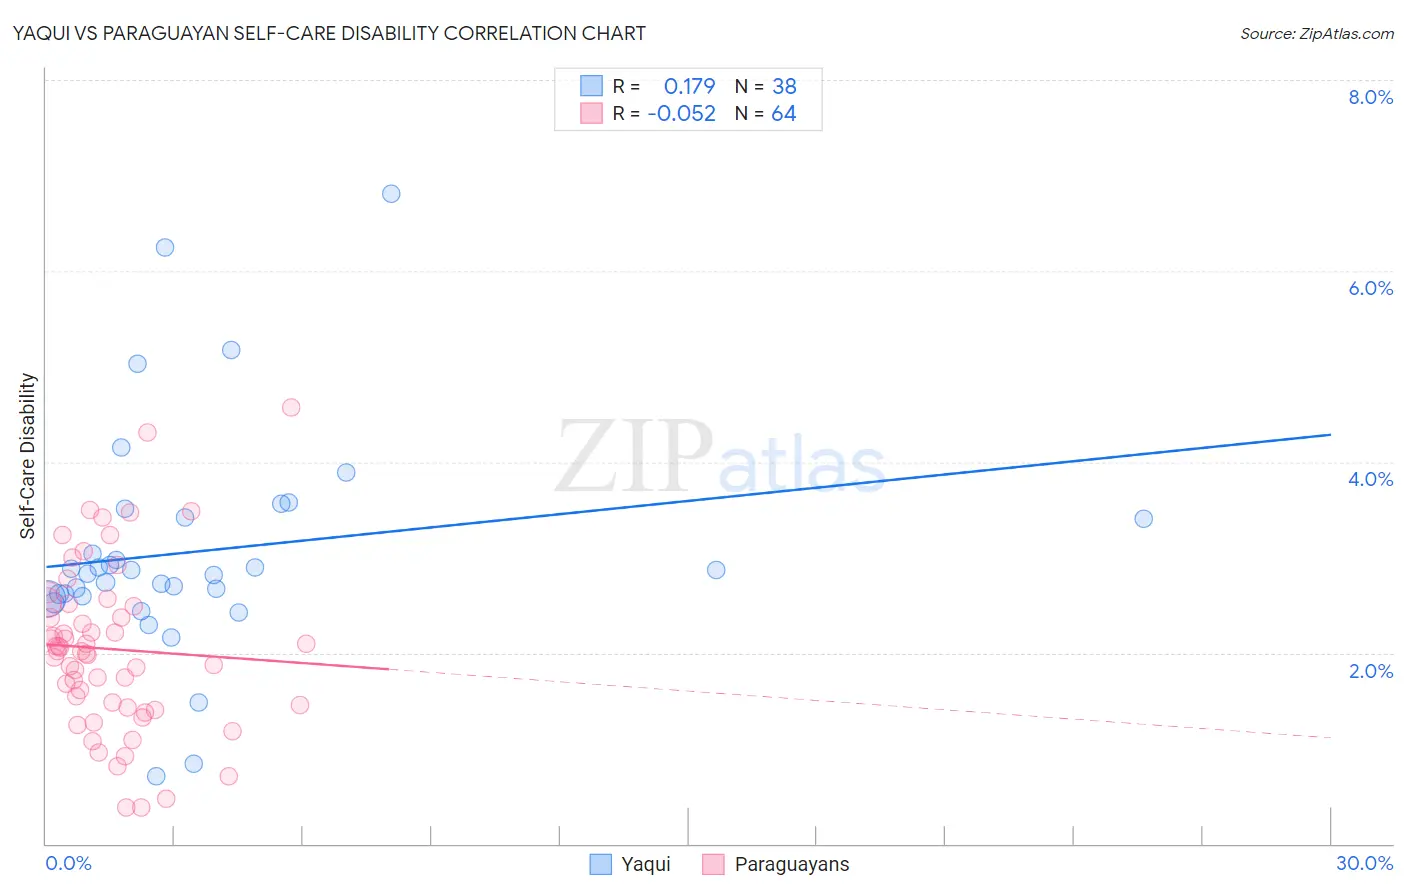
Yaqui vs Paraguayan Self-Care Disability Correlation Chart
The statistical analysis conducted on geographies consisting of 107,691,842 people shows a poor positive correlation between the proportion of Yaqui and percentage of population with self-care disability in the United States with a correlation coefficient (R) of 0.179 and weighted average of 2.7%. Similarly, the statistical analysis conducted on geographies consisting of 95,092,282 people shows a slight negative correlation between the proportion of Paraguayans and percentage of population with self-care disability in the United States with a correlation coefficient (R) of -0.052 and weighted average of 2.3%, a difference of 18.0%.
Self-Care Disability Correlation Summary
| Measurement | Yaqui | Paraguayan |
| Minimum | 0.71% | 0.38% |
| Maximum | 6.8% | 4.6% |
| Range | 6.1% | 4.2% |
| Mean | 3.1% | 2.0% |
| Median | 2.8% | 2.0% |
| Interquartile 25% (IQ1) | 2.6% | 1.4% |
| Interquartile 75% (IQ3) | 3.4% | 2.5% |
| Interquartile Range (IQR) | 0.82% | 1.1% |
| Standard Deviation (Sample) | 1.2% | 0.88% |
| Standard Deviation (Population) | 1.2% | 0.87% |
Similar Demographics by Self-Care Disability
Demographics Similar to Yaqui by Self-Care Disability
In terms of self-care disability, the demographic groups most similar to Yaqui are Immigrants from Mexico (2.7%, a difference of 0.050%), Immigrants from Cambodia (2.7%, a difference of 0.19%), U.S. Virgin Islander (2.7%, a difference of 0.22%), Immigrants from Nicaragua (2.7%, a difference of 0.25%), and Immigrants from Micronesia (2.7%, a difference of 0.25%).
| Demographics | Rating | Rank | Self-Care Disability |
| Chippewa | 0.2 /100 | #260 | Tragic 2.6% |
| Arapaho | 0.2 /100 | #261 | Tragic 2.6% |
| Shoshone | 0.2 /100 | #262 | Tragic 2.7% |
| Immigrants | Latin America | 0.2 /100 | #263 | Tragic 2.7% |
| Immigrants | Iran | 0.2 /100 | #264 | Tragic 2.7% |
| Immigrants | Nicaragua | 0.2 /100 | #265 | Tragic 2.7% |
| Immigrants | Cambodia | 0.1 /100 | #266 | Tragic 2.7% |
| Yaqui | 0.1 /100 | #267 | Tragic 2.7% |
| Immigrants | Mexico | 0.1 /100 | #268 | Tragic 2.7% |
| U.S. Virgin Islanders | 0.1 /100 | #269 | Tragic 2.7% |
| Immigrants | Micronesia | 0.1 /100 | #270 | Tragic 2.7% |
| Trinidadians and Tobagonians | 0.1 /100 | #271 | Tragic 2.7% |
| Immigrants | Laos | 0.1 /100 | #272 | Tragic 2.7% |
| Mexicans | 0.1 /100 | #273 | Tragic 2.7% |
| Yakama | 0.1 /100 | #274 | Tragic 2.7% |
Demographics Similar to Paraguayans by Self-Care Disability
In terms of self-care disability, the demographic groups most similar to Paraguayans are Danish (2.3%, a difference of 0.010%), Burmese (2.3%, a difference of 0.080%), Immigrants from Korea (2.3%, a difference of 0.31%), Immigrants from Zimbabwe (2.3%, a difference of 0.33%), and Immigrants from Turkey (2.3%, a difference of 0.37%).
| Demographics | Rating | Rank | Self-Care Disability |
| Cambodians | 100.0 /100 | #23 | Exceptional 2.2% |
| Cypriots | 100.0 /100 | #24 | Exceptional 2.2% |
| Turks | 100.0 /100 | #25 | Exceptional 2.2% |
| Immigrants | Sri Lanka | 99.9 /100 | #26 | Exceptional 2.2% |
| Venezuelans | 99.9 /100 | #27 | Exceptional 2.2% |
| Inupiat | 99.9 /100 | #28 | Exceptional 2.2% |
| Immigrants | Zimbabwe | 99.9 /100 | #29 | Exceptional 2.3% |
| Paraguayans | 99.9 /100 | #30 | Exceptional 2.3% |
| Danes | 99.9 /100 | #31 | Exceptional 2.3% |
| Burmese | 99.9 /100 | #32 | Exceptional 2.3% |
| Immigrants | Korea | 99.9 /100 | #33 | Exceptional 2.3% |
| Immigrants | Turkey | 99.9 /100 | #34 | Exceptional 2.3% |
| Immigrants | Australia | 99.9 /100 | #35 | Exceptional 2.3% |
| Immigrants | Lithuania | 99.9 /100 | #36 | Exceptional 2.3% |
| Immigrants | Sweden | 99.9 /100 | #37 | Exceptional 2.3% |