Yaqui vs Arab Male Poverty
COMPARE
Yaqui
Arab
Male Poverty
Male Poverty Comparison
Yaqui
Arabs
13.7%
MALE POVERTY
0.0/ 100
METRIC RATING
281st/ 347
METRIC RANK
11.6%
MALE POVERTY
15.8/ 100
METRIC RATING
195th/ 347
METRIC RANK
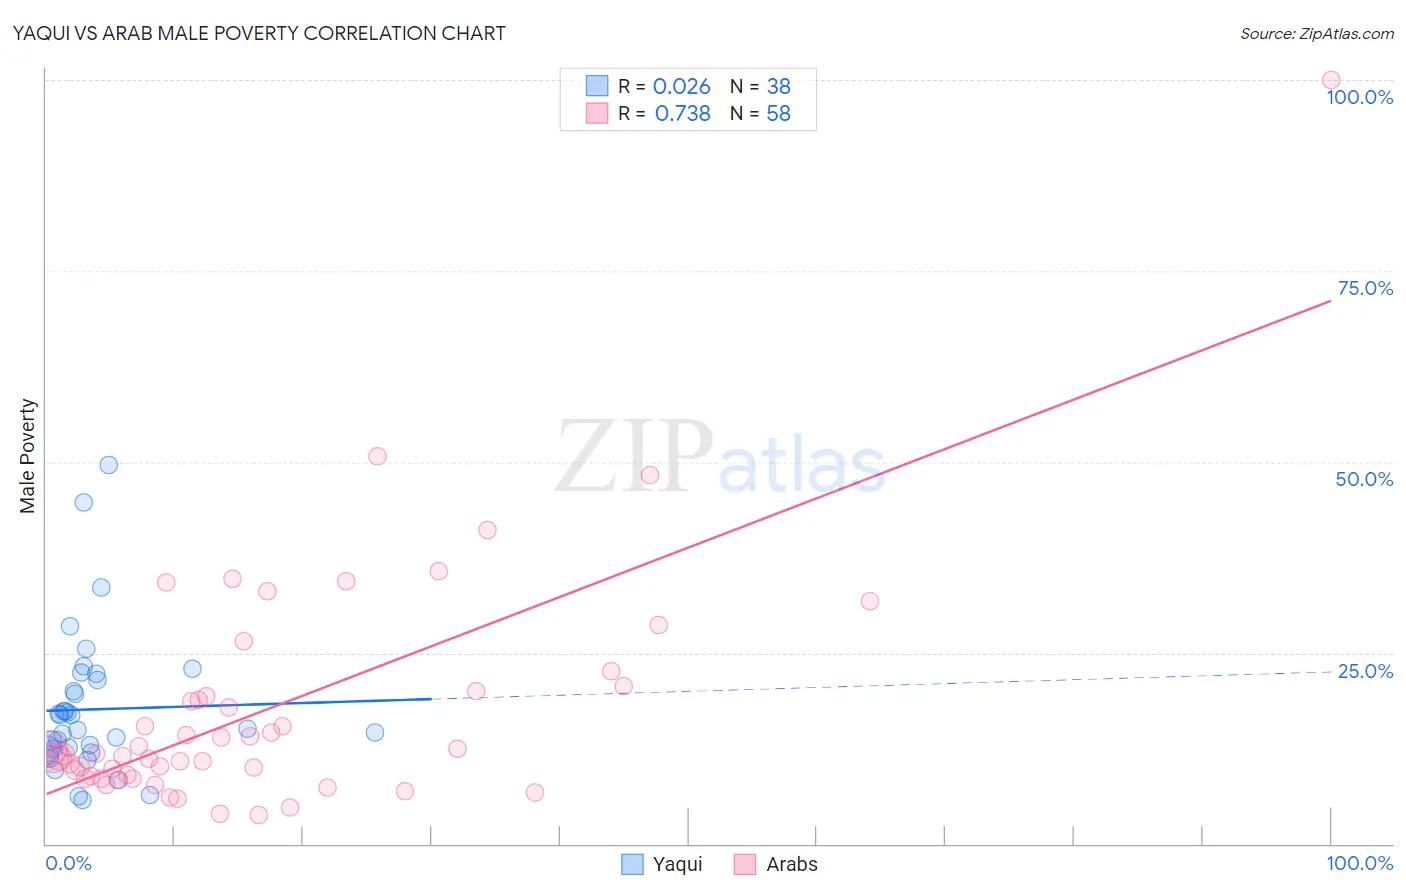
Yaqui vs Arab Male Poverty Correlation Chart
The statistical analysis conducted on geographies consisting of 107,706,572 people shows no correlation between the proportion of Yaqui and poverty level among males in the United States with a correlation coefficient (R) of 0.026 and weighted average of 13.7%. Similarly, the statistical analysis conducted on geographies consisting of 486,080,100 people shows a strong positive correlation between the proportion of Arabs and poverty level among males in the United States with a correlation coefficient (R) of 0.738 and weighted average of 11.6%, a difference of 17.5%.
Male Poverty Correlation Summary
| Measurement | Yaqui | Arab |
| Minimum | 5.7% | 3.8% |
| Maximum | 49.6% | 100.0% |
| Range | 43.9% | 96.2% |
| Mean | 17.6% | 17.7% |
| Median | 15.0% | 11.7% |
| Interquartile 25% (IQ1) | 12.4% | 8.8% |
| Interquartile 75% (IQ3) | 21.5% | 20.0% |
| Interquartile Range (IQR) | 9.1% | 11.2% |
| Standard Deviation (Sample) | 9.3% | 15.6% |
| Standard Deviation (Population) | 9.2% | 15.5% |
Similar Demographics by Male Poverty
Demographics Similar to Yaqui by Male Poverty
In terms of male poverty, the demographic groups most similar to Yaqui are Mexican (13.7%, a difference of 0.050%), Haitian (13.7%, a difference of 0.14%), Immigrants from Cabo Verde (13.7%, a difference of 0.27%), Belizean (13.6%, a difference of 0.32%), and Bangladeshi (13.6%, a difference of 0.41%).
| Demographics | Rating | Rank | Male Poverty |
| Immigrants | West Indies | 0.0 /100 | #274 | Tragic 13.5% |
| Barbadians | 0.0 /100 | #275 | Tragic 13.6% |
| Immigrants | Latin America | 0.0 /100 | #276 | Tragic 13.6% |
| Bangladeshis | 0.0 /100 | #277 | Tragic 13.6% |
| Belizeans | 0.0 /100 | #278 | Tragic 13.6% |
| Haitians | 0.0 /100 | #279 | Tragic 13.7% |
| Mexicans | 0.0 /100 | #280 | Tragic 13.7% |
| Yaqui | 0.0 /100 | #281 | Tragic 13.7% |
| Immigrants | Cabo Verde | 0.0 /100 | #282 | Tragic 13.7% |
| Comanche | 0.0 /100 | #283 | Tragic 13.8% |
| Immigrants | Haiti | 0.0 /100 | #284 | Tragic 13.8% |
| West Indians | 0.0 /100 | #285 | Tragic 13.8% |
| Shoshone | 0.0 /100 | #286 | Tragic 13.8% |
| Immigrants | Barbados | 0.0 /100 | #287 | Tragic 13.8% |
| Immigrants | St. Vincent and the Grenadines | 0.0 /100 | #288 | Tragic 13.8% |
Demographics Similar to Arabs by Male Poverty
In terms of male poverty, the demographic groups most similar to Arabs are Hmong (11.6%, a difference of 0.010%), Immigrants from Kenya (11.6%, a difference of 0.050%), Delaware (11.7%, a difference of 0.070%), Iraqi (11.7%, a difference of 0.21%), and Immigrants from Kuwait (11.6%, a difference of 0.26%).
| Demographics | Rating | Rank | Male Poverty |
| Sierra Leoneans | 29.9 /100 | #188 | Fair 11.4% |
| Hawaiians | 28.3 /100 | #189 | Fair 11.4% |
| Israelis | 26.1 /100 | #190 | Fair 11.5% |
| South American Indians | 22.8 /100 | #191 | Fair 11.5% |
| Immigrants | Uruguay | 19.1 /100 | #192 | Poor 11.6% |
| Immigrants | Kuwait | 17.3 /100 | #193 | Poor 11.6% |
| Immigrants | Kenya | 16.1 /100 | #194 | Poor 11.6% |
| Arabs | 15.8 /100 | #195 | Poor 11.6% |
| Hmong | 15.8 /100 | #196 | Poor 11.6% |
| Delaware | 15.4 /100 | #197 | Poor 11.7% |
| Iraqis | 14.7 /100 | #198 | Poor 11.7% |
| Spanish | 14.1 /100 | #199 | Poor 11.7% |
| Immigrants | Lebanon | 13.6 /100 | #200 | Poor 11.7% |
| Spaniards | 13.5 /100 | #201 | Poor 11.7% |
| Aleuts | 10.4 /100 | #202 | Poor 11.8% |