Yaqui vs Arab Ambulatory Disability
COMPARE
Yaqui
Arab
Ambulatory Disability
Ambulatory Disability Comparison
Yaqui
Arabs
6.8%
AMBULATORY DISABILITY
0.0/ 100
METRIC RATING
281st/ 347
METRIC RANK
5.9%
AMBULATORY DISABILITY
91.5/ 100
METRIC RATING
126th/ 347
METRIC RANK
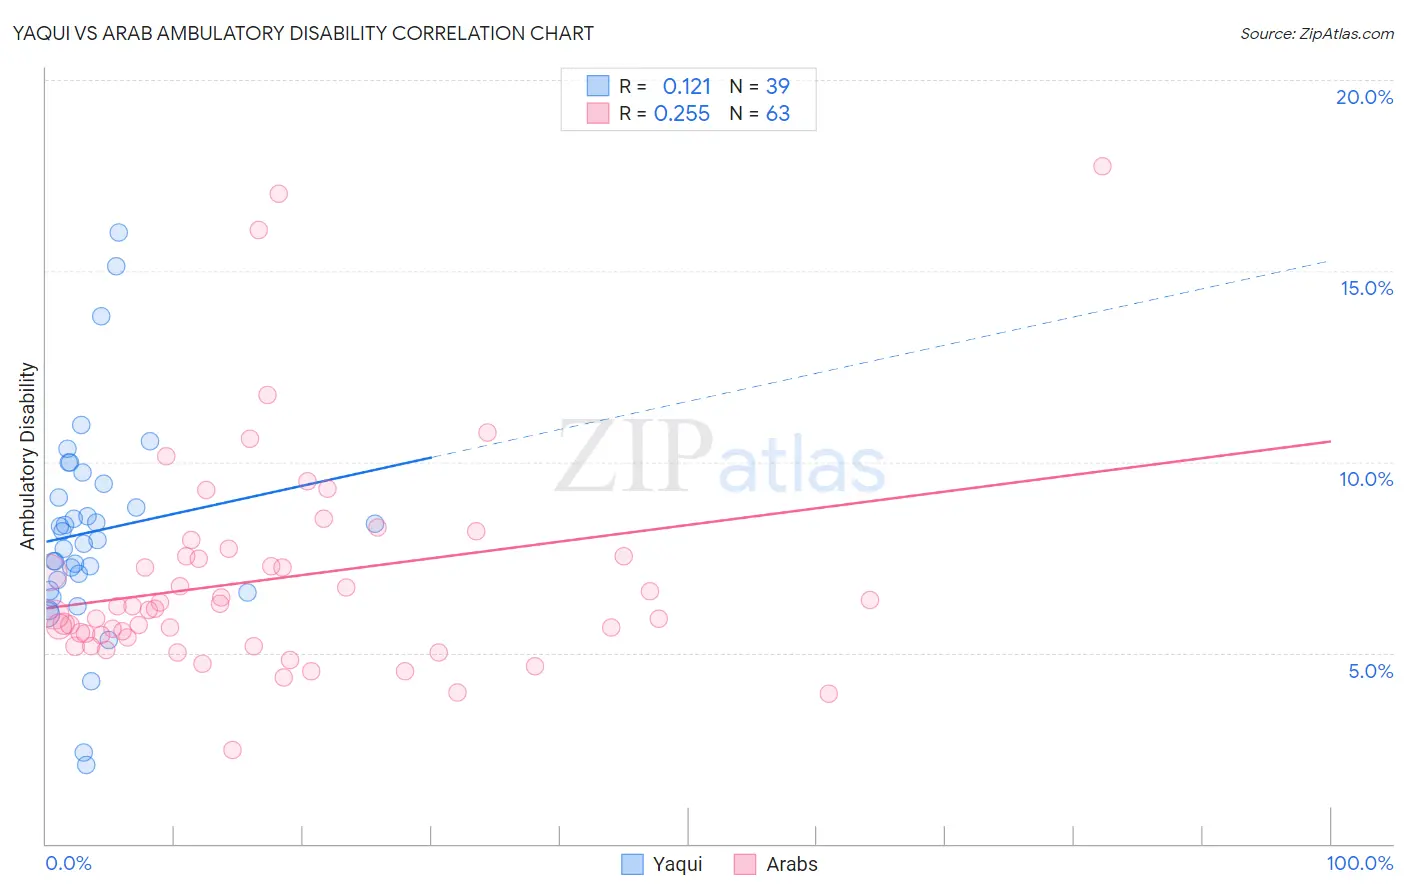
Yaqui vs Arab Ambulatory Disability Correlation Chart
The statistical analysis conducted on geographies consisting of 107,720,926 people shows a poor positive correlation between the proportion of Yaqui and percentage of population with ambulatory disability in the United States with a correlation coefficient (R) of 0.121 and weighted average of 6.8%. Similarly, the statistical analysis conducted on geographies consisting of 486,612,258 people shows a weak positive correlation between the proportion of Arabs and percentage of population with ambulatory disability in the United States with a correlation coefficient (R) of 0.255 and weighted average of 5.9%, a difference of 14.0%.
Ambulatory Disability Correlation Summary
| Measurement | Yaqui | Arab |
| Minimum | 2.1% | 2.5% |
| Maximum | 16.0% | 17.8% |
| Range | 13.9% | 15.3% |
| Mean | 8.2% | 7.0% |
| Median | 8.0% | 6.2% |
| Interquartile 25% (IQ1) | 6.6% | 5.4% |
| Interquartile 75% (IQ3) | 9.4% | 7.5% |
| Interquartile Range (IQR) | 2.8% | 2.1% |
| Standard Deviation (Sample) | 2.8% | 2.9% |
| Standard Deviation (Population) | 2.7% | 2.8% |
Similar Demographics by Ambulatory Disability
Demographics Similar to Yaqui by Ambulatory Disability
In terms of ambulatory disability, the demographic groups most similar to Yaqui are Pennsylvania German (6.8%, a difference of 0.070%), Barbadian (6.8%, a difference of 0.13%), Immigrants from Caribbean (6.7%, a difference of 0.17%), Immigrants from Barbados (6.8%, a difference of 0.28%), and Immigrants from Jamaica (6.8%, a difference of 0.35%).
| Demographics | Rating | Rank | Ambulatory Disability |
| Sioux | 0.1 /100 | #274 | Tragic 6.7% |
| Immigrants | Guyana | 0.1 /100 | #275 | Tragic 6.7% |
| Celtics | 0.1 /100 | #276 | Tragic 6.7% |
| Jamaicans | 0.1 /100 | #277 | Tragic 6.7% |
| Immigrants | West Indies | 0.1 /100 | #278 | Tragic 6.7% |
| Immigrants | Caribbean | 0.0 /100 | #279 | Tragic 6.7% |
| Pennsylvania Germans | 0.0 /100 | #280 | Tragic 6.8% |
| Yaqui | 0.0 /100 | #281 | Tragic 6.8% |
| Barbadians | 0.0 /100 | #282 | Tragic 6.8% |
| Immigrants | Barbados | 0.0 /100 | #283 | Tragic 6.8% |
| Immigrants | Jamaica | 0.0 /100 | #284 | Tragic 6.8% |
| Fijians | 0.0 /100 | #285 | Tragic 6.8% |
| Yakama | 0.0 /100 | #286 | Tragic 6.8% |
| U.S. Virgin Islanders | 0.0 /100 | #287 | Tragic 6.8% |
| Immigrants | Nonimmigrants | 0.0 /100 | #288 | Tragic 6.9% |
Demographics Similar to Arabs by Ambulatory Disability
In terms of ambulatory disability, the demographic groups most similar to Arabs are Korean (5.9%, a difference of 0.020%), Immigrants from Nigeria (5.9%, a difference of 0.10%), Immigrants from Western Asia (5.9%, a difference of 0.13%), Immigrants from Middle Africa (5.9%, a difference of 0.14%), and Immigrants from Norway (5.9%, a difference of 0.17%).
| Demographics | Rating | Rank | Ambulatory Disability |
| Norwegians | 93.1 /100 | #119 | Exceptional 5.9% |
| Estonians | 92.9 /100 | #120 | Exceptional 5.9% |
| Costa Ricans | 92.6 /100 | #121 | Exceptional 5.9% |
| Icelanders | 92.6 /100 | #122 | Exceptional 5.9% |
| Immigrants | Russia | 92.4 /100 | #123 | Exceptional 5.9% |
| Immigrants | Middle Africa | 92.2 /100 | #124 | Exceptional 5.9% |
| Koreans | 91.6 /100 | #125 | Exceptional 5.9% |
| Arabs | 91.5 /100 | #126 | Exceptional 5.9% |
| Immigrants | Nigeria | 90.9 /100 | #127 | Exceptional 5.9% |
| Immigrants | Western Asia | 90.7 /100 | #128 | Exceptional 5.9% |
| Immigrants | Norway | 90.5 /100 | #129 | Exceptional 5.9% |
| Immigrants | Kazakhstan | 89.7 /100 | #130 | Excellent 5.9% |
| Immigrants | Costa Rica | 89.5 /100 | #131 | Excellent 5.9% |
| Immigrants | Europe | 87.8 /100 | #132 | Excellent 6.0% |
| Immigrants | Immigrants | 86.9 /100 | #133 | Excellent 6.0% |