Eastern European vs Arab Self-Care Disability
COMPARE
Eastern European
Arab
Self-Care Disability
Self-Care Disability Comparison
Eastern Europeans
Arabs
2.3%
SELF-CARE DISABILITY
99.2/ 100
METRIC RATING
72nd/ 347
METRIC RANK
2.4%
SELF-CARE DISABILITY
75.7/ 100
METRIC RATING
149th/ 347
METRIC RANK
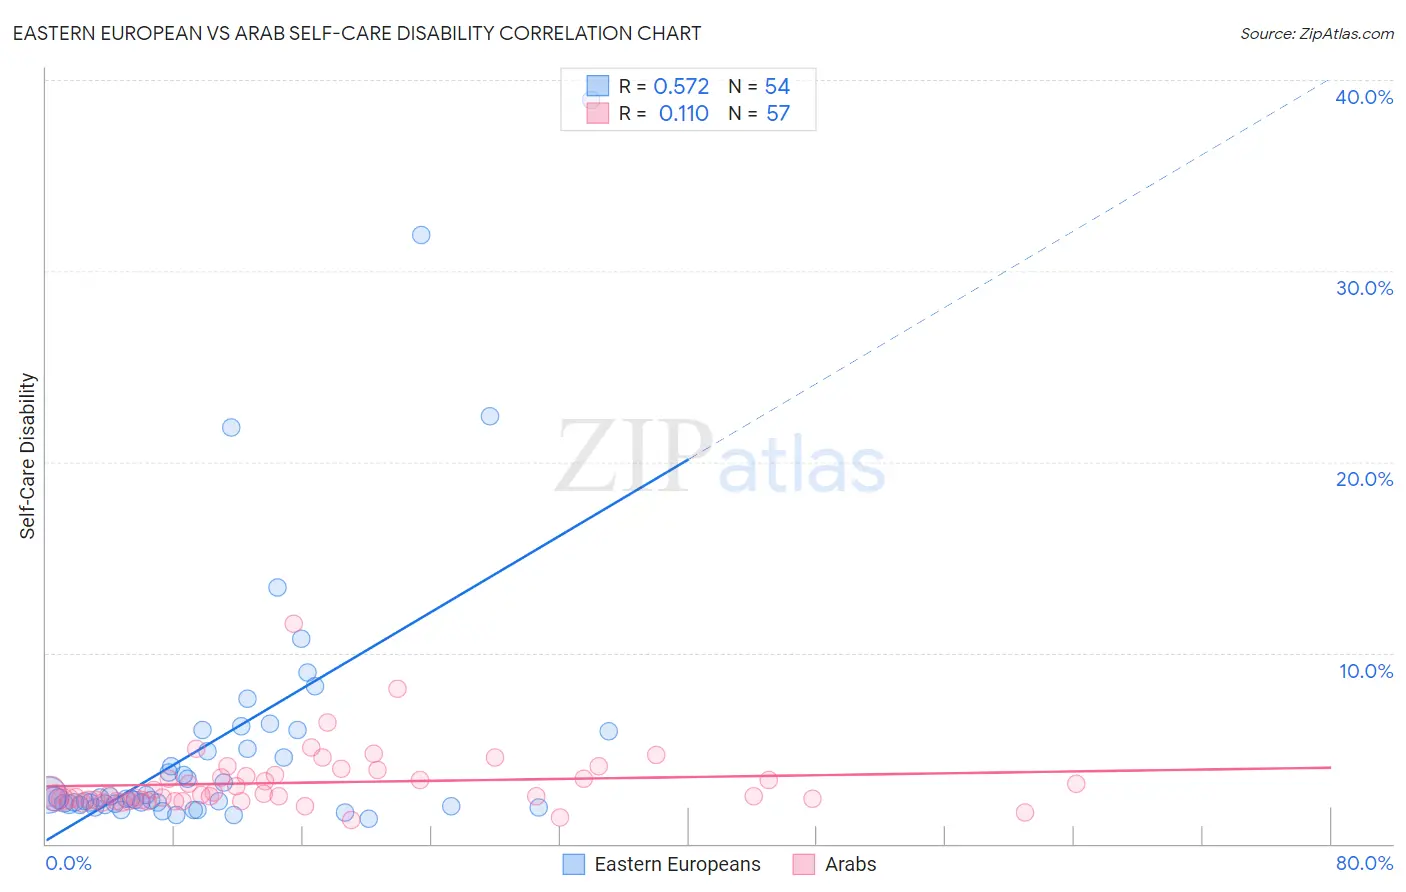
Eastern European vs Arab Self-Care Disability Correlation Chart
The statistical analysis conducted on geographies consisting of 460,402,865 people shows a substantial positive correlation between the proportion of Eastern Europeans and percentage of population with self-care disability in the United States with a correlation coefficient (R) of 0.572 and weighted average of 2.3%. Similarly, the statistical analysis conducted on geographies consisting of 485,999,863 people shows a poor positive correlation between the proportion of Arabs and percentage of population with self-care disability in the United States with a correlation coefficient (R) of 0.110 and weighted average of 2.4%, a difference of 4.6%.
Self-Care Disability Correlation Summary
| Measurement | Eastern European | Arab |
| Minimum | 1.3% | 1.3% |
| Maximum | 39.0% | 11.5% |
| Range | 37.7% | 10.3% |
| Mean | 5.4% | 3.2% |
| Median | 2.4% | 2.5% |
| Interquartile 25% (IQ1) | 2.1% | 2.3% |
| Interquartile 75% (IQ3) | 5.9% | 3.6% |
| Interquartile Range (IQR) | 3.8% | 1.3% |
| Standard Deviation (Sample) | 7.4% | 1.6% |
| Standard Deviation (Population) | 7.3% | 1.6% |
Similar Demographics by Self-Care Disability
Demographics Similar to Eastern Europeans by Self-Care Disability
In terms of self-care disability, the demographic groups most similar to Eastern Europeans are Asian (2.3%, a difference of 0.030%), Immigrants from Egypt (2.3%, a difference of 0.030%), Immigrants from Northern Europe (2.3%, a difference of 0.070%), Immigrants from Switzerland (2.3%, a difference of 0.090%), and Immigrants from Zaire (2.3%, a difference of 0.10%).
| Demographics | Rating | Rank | Self-Care Disability |
| Brazilians | 99.3 /100 | #65 | Exceptional 2.3% |
| Immigrants | Argentina | 99.3 /100 | #66 | Exceptional 2.3% |
| South Africans | 99.3 /100 | #67 | Exceptional 2.3% |
| Immigrants | Zaire | 99.2 /100 | #68 | Exceptional 2.3% |
| Immigrants | Norway | 99.2 /100 | #69 | Exceptional 2.3% |
| Immigrants | Northern Europe | 99.2 /100 | #70 | Exceptional 2.3% |
| Asians | 99.2 /100 | #71 | Exceptional 2.3% |
| Eastern Europeans | 99.2 /100 | #72 | Exceptional 2.3% |
| Immigrants | Egypt | 99.1 /100 | #73 | Exceptional 2.3% |
| Immigrants | Switzerland | 99.1 /100 | #74 | Exceptional 2.3% |
| Immigrants | Netherlands | 99.1 /100 | #75 | Exceptional 2.3% |
| Immigrants | China | 99.1 /100 | #76 | Exceptional 2.3% |
| Immigrants | Middle Africa | 99.0 /100 | #77 | Exceptional 2.3% |
| Immigrants | Ireland | 99.0 /100 | #78 | Exceptional 2.3% |
| Immigrants | Kenya | 99.0 /100 | #79 | Exceptional 2.3% |
Demographics Similar to Arabs by Self-Care Disability
In terms of self-care disability, the demographic groups most similar to Arabs are Romanian (2.4%, a difference of 0.010%), Immigrants from Costa Rica (2.4%, a difference of 0.040%), Basque (2.4%, a difference of 0.11%), Dutch (2.4%, a difference of 0.12%), and Tlingit-Haida (2.4%, a difference of 0.14%).
| Demographics | Rating | Rank | Self-Care Disability |
| Immigrants | Peru | 83.2 /100 | #142 | Excellent 2.4% |
| Afghans | 82.3 /100 | #143 | Excellent 2.4% |
| Costa Ricans | 80.8 /100 | #144 | Excellent 2.4% |
| Germans | 80.1 /100 | #145 | Excellent 2.4% |
| Israelis | 80.0 /100 | #146 | Good 2.4% |
| Dutch | 77.5 /100 | #147 | Good 2.4% |
| Romanians | 75.8 /100 | #148 | Good 2.4% |
| Arabs | 75.7 /100 | #149 | Good 2.4% |
| Immigrants | Costa Rica | 75.1 /100 | #150 | Good 2.4% |
| Basques | 74.0 /100 | #151 | Good 2.4% |
| Tlingit-Haida | 73.5 /100 | #152 | Good 2.4% |
| Immigrants | England | 73.5 /100 | #153 | Good 2.4% |
| Italians | 72.2 /100 | #154 | Good 2.4% |
| Pakistanis | 71.4 /100 | #155 | Good 2.4% |
| Nigerians | 70.6 /100 | #156 | Good 2.4% |